S&P 500 Explained: A Trader’s Guide
The S&P 500 is not just another stock market index; it’s the heartbeat of the U.S. economy and a leading indicator for global markets. Traders test their skills by speculating on price movements, aiming for short-term gains. For those who thrive on volatility and rapid market shifts, the S&P 500 offers a unique playground filled with opportunities.
This index, comprised of 500 of the largest U.S. companies, serves as a real-time barometer of market sentiment. Its fluctuations can be dramatic, reflecting investor confidence, economic data releases, geopolitical events, and many other factors. These fluctuations create the potential for profits for those who can accurately analyze the index’s short-term direction.
While long-term investors often use the S&P 500 as a benchmark for portfolio performance, traders approach it differently. They utilize technical analysis, sentiment analysis, and a deep understanding of market dynamics to capitalize on short-term price swings. Whether through day trading, swing trading, or scalping, the S&P 500 offers a diverse range of trading opportunities.
This article is your guide to mastering the S&P 500 as a trading instrument. We’ll delve into the factors that drive its price movements, explore various strategies, and discuss essential risk management techniques.
What is the S&P 500?
The S&P 500, often referred to as simply the “S&P” is a stock market index that tracks the performance of 500 of the largest companies listed on the U.S. stock exchanges. It’s designed to be a representative sample of the overall U.S. equity market, covering roughly 80% of the total market capitalization.
This index is a key indicator of the health and direction of the U.S. economy. When the S&P 500 rises, it generally signals that investors are confident in the future prospects of American businesses. Conversely, a decline in the index often reflects growing concerns about economic conditions.
A Brief History
The S&P 500 was first introduced in 1957 by Standard & Poor’s, a financial services company. Initially, it included only 425 industrial stocks, 60 utilities, and 15 railroad companies. Over time, the index has evolved to include a more diverse range of sectors, reflecting the changing landscape of the U.S. economy.
How it Works
The S&P 500 is a market-capitalization-weighted index, meaning that companies with larger market capitalizations have a greater impact on the index’s overall value. This weighting methodology ensures that the index accurately reflects the relative influence of each company in the market.
To be included in the S&P 500, a company must meet certain criteria, including:
- Market Capitalization: The company must have a market capitalization of at least $14.6 billion.
- Liquidity: The company’s shares must be actively traded, with a sufficient trading volume to ensure liquidity.
- Financial Viability: The company must demonstrate financial soundness and profitability.
- Public Float: A minimum percentage of the company’s shares must be available for public trading.
- Sector Representation: The index aims to maintain a balanced representation of various sectors in the economy.
The S&P 500 is constantly evolving, with companies being added or removed as they meet or fail to meet these criteria. This dynamic nature ensures that the index remains a relevant and accurate reflection of the U.S. equity market.
The S&P 500 as a Trading Instrument
The S&P 500 is not only a benchmark for long-term investors but also a versatile and powerful tool for traders seeking to profit from short-term price fluctuations. Its unique characteristics make it an attractive instrument for various trading strategies.
Advantages of Trading the S&P 500
The S&P 500, renowned for its high liquidity, volatility, and accessibility, is a prime instrument for traders worldwide. As one of the most actively traded indexes globally, the S&P 500 ensures tight spreads and quick execution of trades, making it easier for traders to enter and exit positions. Its regular price swings due to market sentiment, news events, and economic data releases create multiple opportunities for traders to capture profits. Additionally, traders can access the S&P 500 through various financial instruments, including futures contracts, exchange-traded funds (ETFs), and options, allowing them to choose the instrument that best suits their risk tolerance and trading style.
Why Trade the S&P 500 with E8 Markets?
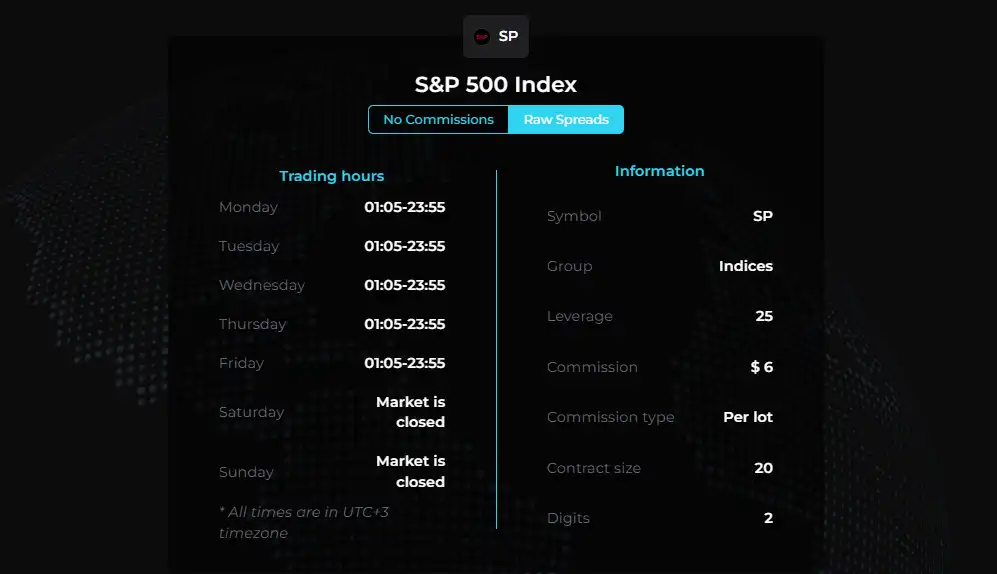
Tight Spreads or Raw Pricing: At E8 we offer competitive spread options, allowing traders to choose between tight spreads or raw spreads with commission. This flexibility caters to different trading styles and preferences, ensuring optimal execution for every trader.
Leverage: E8 Markets provides up to 25:1 leverage on S&P 500 trading, enabling traders to amplify their potential profits with a smaller initial balance. However, it’s crucial to remember that leverage also magnifies potential losses, so risk management is paramount.
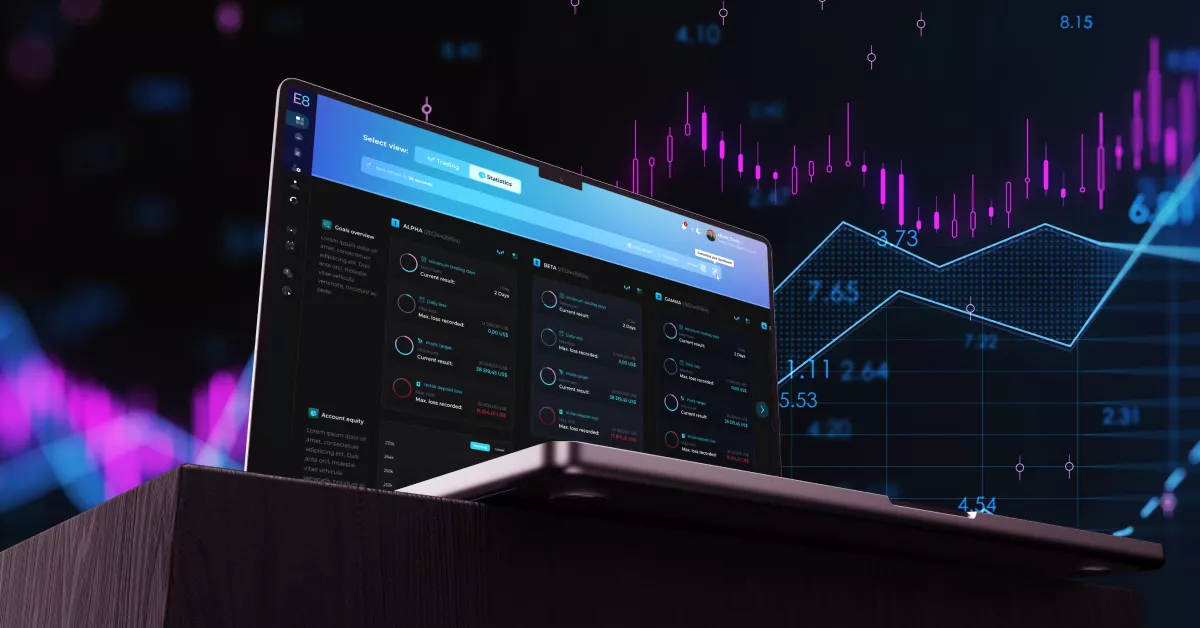
Powerful Trading Platforms: E8 Traders can choose between two leading platforms, Platform 5 and MatchTrader, both known for their advanced charting tools, technical indicators, and user-friendly interfaces. These platforms are accessible on desktop, mobile (iOS and Android), and web browsers, ensuring you can trade the S&P 500 from anywhere, anytime.
E8X Dashboard alongside supported Platform 5 and MatchTrader, offers a wealth of tools to help traders analyze and execute trades in the S&P 500:
- Technical Analysis: Both platforms provide a wide range of technical indicators, drawing tools, and chart patterns to identify trends, support and resistance levels, and potential entry and exit points.
- Fundamental Analysis: Traders can access real-time economic data releases, news feeds, and market analysis directly through the platforms, aiding in fundamental analysis and decision-making.
- Automated Trading: Platform 5 supports automated trading, allowing traders to create and implement their own automated trading strategies.
- Risk Management: Platform 5 and MatchTrader offer risk management tools, including stop-loss orders and take-profit orders, helping traders protect their balance and manage risk effectively.
Understanding S&P 500 Price Movements
Short-term traders live and breathe by the fluctuations of the S&P 500. Understanding the factors that drive these price movements is crucial for making informed trading decisions and maximizing profits.
Key Factors Influencing Short-Term Fluctuations
Economic Data Releases: Reports on GDP growth, employment, inflation, and other economic indicators have a significant impact on the S&P 500. Positive data often leads to bullish sentiment, while negative data can trigger sell-offs. Traders closely monitor economic calendars and react quickly to these releases.
Company Earnings: Quarterly earnings reports from major companies within the S&P 500 can cause substantial price swings. Strong earnings often boost investor confidence, while disappointing results can lead to sharp declines.
Geopolitical Events: Political instability, trade wars, and international conflicts can create uncertainty in the markets, leading to volatility in the S&P 500. When trading you need to stay informed about global events and assess their potential impact on the index.
Central Bank Policies: The Federal Reserve’s monetary policy decisions, such as interest rate changes or quantitative easing measures, have a direct influence on the S&P 500. Traders closely watch Fed announcements and adjust their strategies accordingly.
Market Sentiment: Investor sentiment, often driven by news headlines, social media, and other factors, can play a significant role in short-term price movements. A wave of optimism can propel the index higher, while a surge of fear can trigger a rapid decline.
Technical Analysis Techniques
Technical analysis is a powerful tool for identifying potential trading opportunities in the S&P 500. Traders use various chart patterns, indicators, and oscillators to analyze price movements and predict future trends. Some common techniques include:
Support and Resistance Levels: These are price levels where the index has historically tended to bounce or stall. Such levels are used to identify potential entry or exit points.
Trend Lines: These are lines drawn on a chart that connect a series of highs or lows, indicating the direction of the trend. Trend lines usually confirm the current trend and anticipate potential reversals.
Moving Averages: These are calculated averages of past prices that smooth out price fluctuations and help identify trends. Moving averages work as dynamic support and resistance levels.
Relative Strength Index (RSI): This is a momentum oscillator that measures the magnitude of recent price changes to evaluate overbought or oversold conditions. RSI is mostly used to gauge the strength of a trend and identify potential reversals.
Sentiment Analysis
Sentiment analysis involves gauging the overall mood of the market by analyzing news articles, social media posts, and other sources of information. This can help traders understand the prevailing sentiment and anticipate potential market movements.
While sentiment analysis can be subjective, it can provide valuable insights when combined with other forms of analysis. Traders often use sentiment analysis to confirm their technical or fundamental views and make more informed trading decisions.
Managing Risk in S&P 500 Trading
The S&P 500’s volatility presents a double-edged sword for traders. While it offers the potential for significant profits, it also exposes them to substantial risks. Effective risk management is crucial for navigating this volatile market and protecting your account from excessive losses.
The Importance of Stop-Loss Orders
Stop-loss orders are essential tools for risk management. They allow you to automatically exit a trade if the price moves against you by a certain amount, limiting your potential losses. Setting appropriate stop-loss levels is crucial, as they should be close enough to protect your balance but not so tight that they trigger prematurely due to normal market fluctuations.
Risk Management Strategies
In addition to stop-loss orders, traders should employ a variety of risk management strategies to safeguard their balance:
- Position Sizing: Determine the appropriate position size for each trade based on your risk tolerance and account size. Avoid risking a large percentage of your trading balance on any single trade.
- Diversification: Diversify your portfolio by trading multiple instruments or asset classes. This can help reduce your overall risk exposure and protect your balance from a single market downturn.
- Risk-Reward Ratio: Assess the potential risk and reward of each trade before entering it. Aim for trades with a favorable risk-reward ratio, where the potential profit outweighs the potential loss.
- Trading Plan: Develop a well-defined trading plan that outlines your entry and exit strategies, risk tolerance, and profit targets. Stick to your plan and avoid impulsive decisions driven by emotions.
- Continuous Learning: The financial markets are constantly evolving. Stay informed about market trends, economic data, and news events that could impact the S&P 500. Continuously educate yourself and adapt your trading strategies as needed.
Volatility and Its Impact
Volatility is a natural characteristic of the S&P 500, and it’s essential to understand its impact on short-term trading. High volatility can lead to rapid price swings, creating both opportunities and risks for traders.
Traders should adjust their risk management strategies during periods of heightened volatility. This may involve tightening stop-loss levels, reducing position sizes, or using options to hedge their positions. It’s also important to maintain discipline and avoid chasing losses during volatile market conditions.
Common Mistakes and How to Avoid Them
Traders often make several common mistakes that can lead to losses in the S&P 500:
- Overtrading: Avoid taking too many trades based on emotions or hunches. Stick to your trading plan and only enter trades that meet your criteria.
- Chasing Losses: Don’t try to recover losses by increasing your position size or taking revenge trades. Accept losses as part of trading and move on to the next opportunity.
- Ignoring Risk Management: Don’t neglect risk management practices like stop-loss orders and position sizing. These are essential tools for protecting your balance.
- Not Adapting to Changing Market Conditions: Markets are dynamic, and what works in one market environment may not work in another. Stay informed and adapt your strategies as needed.
By understanding these common pitfalls and taking proactive measures to avoid them, traders can improve their chances of success in the S&P 500 market.
Mastering the S&P 500
The S&P 500 is not just a stock index; it’s a dynamic market with significant potential for short-term traders. By understanding the factors influencing its price movements, utilizing technical and sentiment analysis, and implementing robust risk management strategies, traders can navigate its volatility and capitalize on opportunities.
E8 Markets offers a comprehensive platform for trading the S&P 500, providing traders with competitive trading conditions and many analytical tools. Whether you’re a seasoned professional or a novice trader, E8 Markets equips you with the resources you need to succeed in this exciting market.
Remember, successful S&P 500 trading requires continuous learning, adaptation, and discipline. Stay informed about market trends, economic data, and global events that could impact the index. By combining your knowledge, skills, and the tools provided by E8 Markets, you can master the S&P 500 as your trading instrument and potentially achieve your trading goals.
Article topics
Trade with E8 Markets
Start our evaluation and get opportunity to start earning.Suggested Articles:


Disclaimer
The information provided on this website is for informational purposes only and should not be construed as investment advice. Always conduct your own research and consult with a qualified financial advisor before making any investment decisions. We do not endorse or promote any specific investments, and any decisions you make are at your own risk. This website and its content are not responsible for any financial losses or gains you may experience.
Please consult with a legal professional to ensure this disclaimer complies with any applicable laws and regulations in your jurisdiction.