Pivot Points: A Comprehensive Guide for Traders
Pivot points are a technical analysis tool used to identify general market trends and potential support and resistance levels. They are calculated from the average of the high, low, and closing prices of the previous trading session. Traders use these points to make decisions about entry and exit points, and stop-loss levels, and to gauge the market’s overall direction. They are popular in forex, stock, and commodities markets and can be combined with other Technical Indicators for enhanced analysis.
Traders can plan their strategies around these points, considering positions below the pivot for selling and above for buying. They often set S1, S2, R1, and R2 levels as targets or stop-loss orders. Moreover, when pivot points align with other indicators like moving averages or Fibonacci levels, they offer enhanced support or resistance signals.
How to Calculate Pivot Points
When trading on platforms like MetaTrader or analyzing markets on TradingView, pivot points are automatically calculated for you. Nonetheless, it’s beneficial to understand and remember the process behind these calculations.
Fundamentally, the classic pivot point is the average of three figures: the previous day’s high, low, and close price. It is calculated using the previous day’s trading data, which is usually taken from the New York closing time (21:00 GMT).
If the Previous Closing (PC) price for the currency pair GBP/USD was 1.2613, the Previous High (PH) was 1.2789 and the Previous Low (PL) was 1.2501, the pivot point (P), which is the average, is going to be derived as follows:
P = (1.2501 (PL) + 1.2789 (PH) + 1.2613 (PC))/3
ANS = 1.2634
The calculations don’t end here, however. You can use the result to get the support and resistance levels that inform you about the price thresholds, where traders were not willing to go beyond. Therefore, they can be quite useful in estimating the current day’s range.
You can calculate up to three levels of support and resistance:
Support 1 = (Pivot x 2) – High
Resistance 1 = (Pivot x 2) – Low
To calculate Support 2 and Resistance 2 levels, you need to determine the Range, which is the difference between the Previous Day’s High and the Previous Day’s Low:
Range = Previous High – Previous Low
Support 2 = Pivot – Range
Resistance 2 = Pivot + Range – Previous Low
You can also calculate the third level of support and resistance lines as follows:
Support 3 = Low – 2(High – Pivot)
Resistance 3 = High + 2(Pivot – Low)
Note: There are also other calculation methods, such as the Woodie, Camarilla, Fibonacci, and Tom DeMark methods.
How to Use Pivot Points in Forex Trading
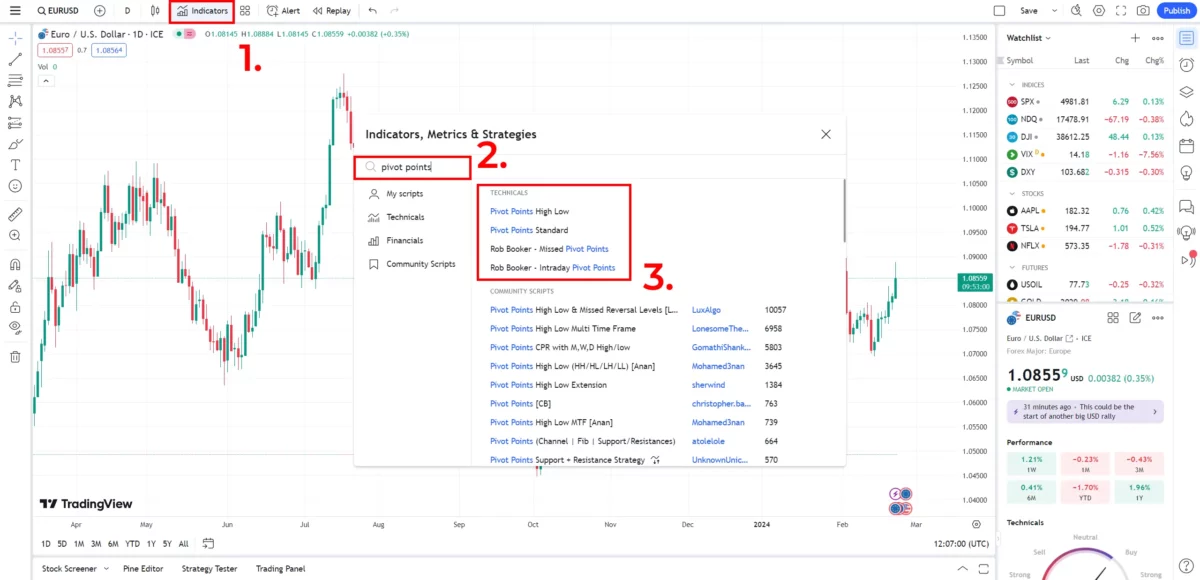
Before exploring how to use this indicator in your trading approach, let’s start by adding Pivot Points to your charts. We’ll use the widely recognized TradingView platform for this purpose.
Step 1: Go to TradingView, choose ‘Select Product’, then click on ‘Supercharts’.

Step 2: Click ‘Indicators’ in the top left, search for ‘Pivot Points’, and select ‘Pivot Points Standard’ from the list to keep it straightforward.
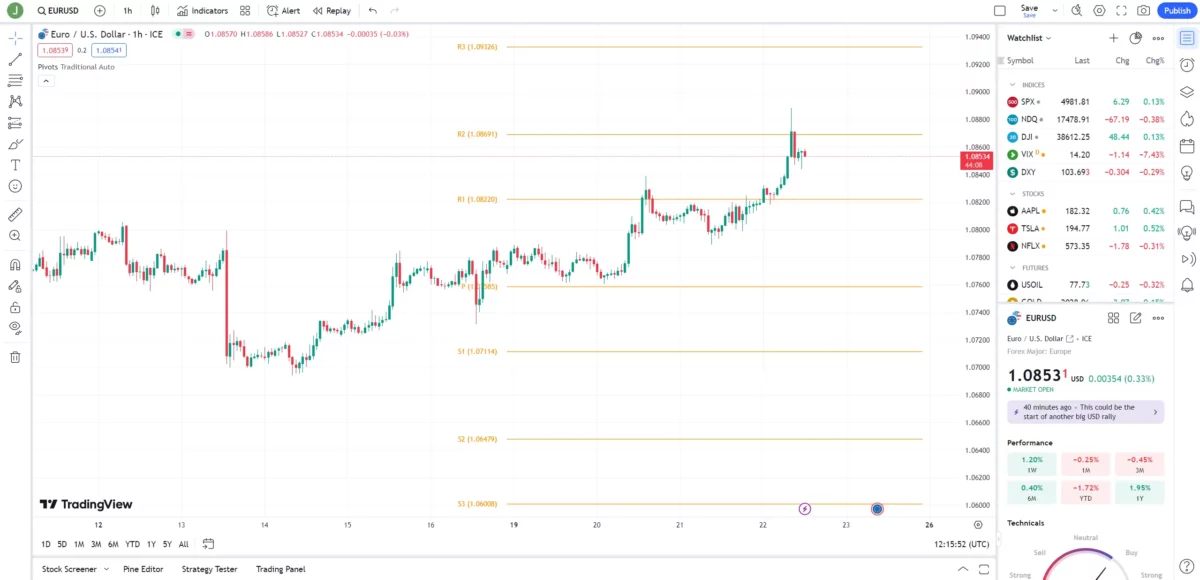
Step 3: Customize the indicator to align with your trading strategy, and you’re all set!
Now, let’s discuss various strategies to leverage the Pivot Point indicator in your trading:
Determining Take-Profit and Stop-Loss Levels: If the market is trending up, you can exit your long positions at R1, R2, or R3 levels, depending on your risk appetite and trading style. You can move your stop-loss to S1, S2, or S3 levels as the market moves in your favor.
Trading Breakouts and Entries: Pivot points can indicate potential breakouts and entries when the market is ranging. For example, if the market breaks above R1, it indicates a bullish momentum. You can also look for retests of the points as confirmation of the breakout; e.g., if the market breaks above R1 and then retests it as support, it validates the breakout.
Trading Counter-Trend Trades and Reversals: You can use the pivot points to identify possible reversal points when the market is overbought or oversold. If the market reaches R3, it indicates a strong resistance level, and you can look for signs of a bearish reversal. Other indicators such as oscillators or candlestick patterns can confirm the reversal signal. For instance, if the market reaches R3 and shows a bearish divergence or a shooting star candlestick, it suggests a high probability of a downtrend.
Pitfalls in Using Pivot Points
Pivot points, while straightforward in their calculation, may not suit every trader. There’s no guarantee that the market will stop and reverse at the indicated levels, as it can also break through, or not even reach the level. Therefore, pivot points should form just one part of a broader, comprehensive trading strategy.
Article topics
Trade with E8 Markets
Start our evaluation and get opportunity to start earning.Suggested Articles:


Disclaimer
The information provided on this website is for informational purposes only and should not be construed as investment advice. Always conduct your own research and consult with a qualified financial advisor before making any investment decisions. We do not endorse or promote any specific investments, and any decisions you make are at your own risk. This website and its content are not responsible for any financial losses or gains you may experience.
Please consult with a legal professional to ensure this disclaimer complies with any applicable laws and regulations in your jurisdiction.