Maximize Trading Success with Key Technical Indicators
Technical indicators are crucial tools in trading, offering insights into historical price data and market trends. In this comprehensive guide, we will explore leading technical indicators such as moving averages, RSI (Relative Strength Index), MACD (Moving Average Convergence Divergence), Bollinger Bands, and the Average True Range (ATR). Understanding these indicators is key to making informed trading decisions and maximizing your trading success.
5 Most Popular Technical Indicators
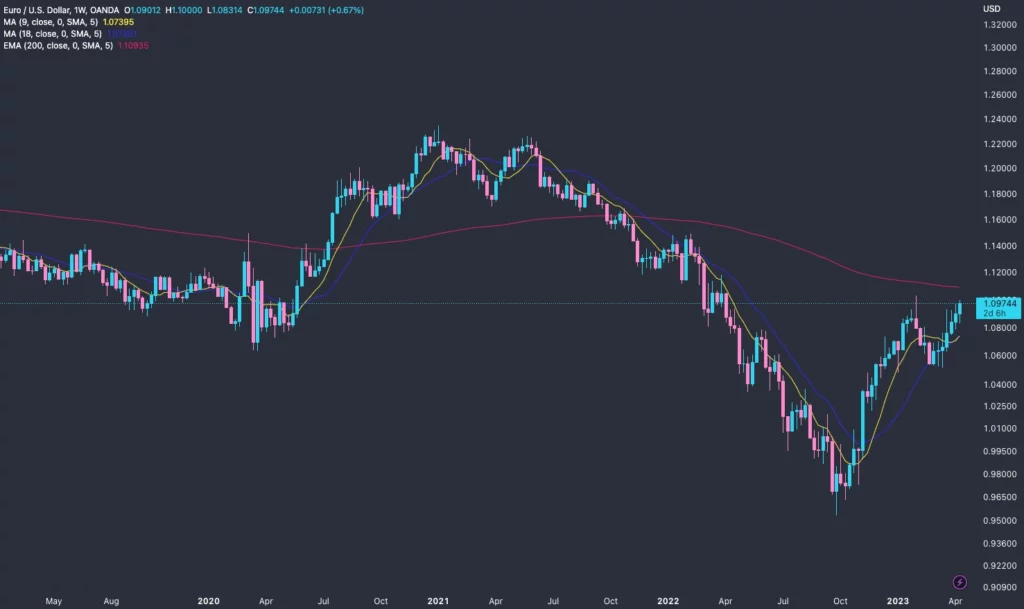
Moving Averages: A Cornerstone of Technical Indicators
Moving Averages are fundamental among technical indicators, smoothing out price data to reveal underlying market trends. There are two primary types: Simple Moving Averages (SMA) and Exponential Moving Averages (EMA). SMAs calculate the average price over a specified period, while EMAs give more weight to recent price data. Utilizing moving averages helps traders identify market trends, potential support and resistance levels, and generate actionable trading signals through crossovers.
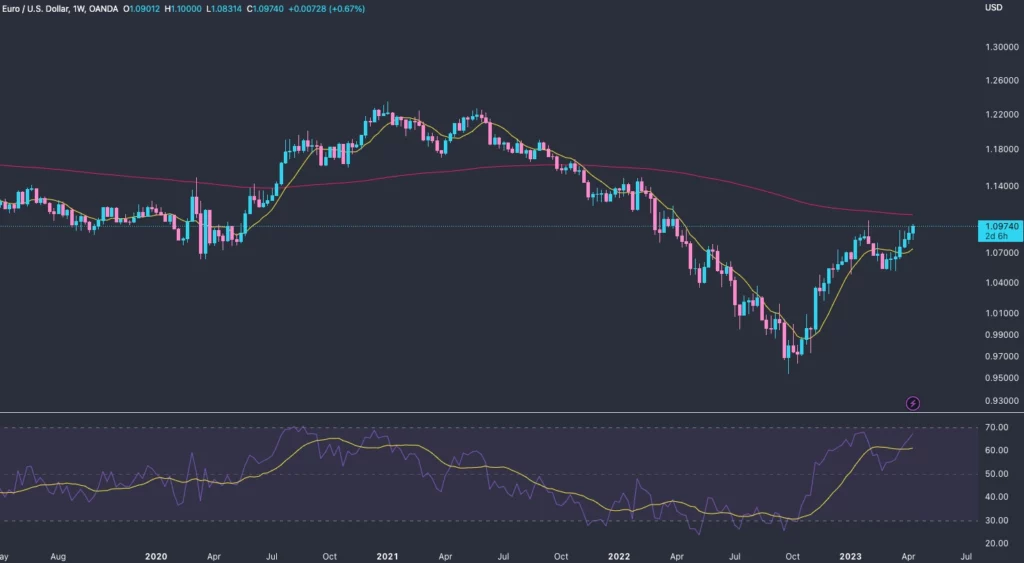
RSI (Relative Strength Index): Gauging Market Momentum
The RSI is a vital momentum oscillator in technical analysis that gauges the velocity and change of price movements. With its range from 0 to 100, values above 70 indicate overbought conditions, and those below 30 suggest an oversold market. The RSI helps traders spot potential trend reversals, and its divergences can be critical indicators of market shifts, making it a valuable tool in any trader’s arsenal.
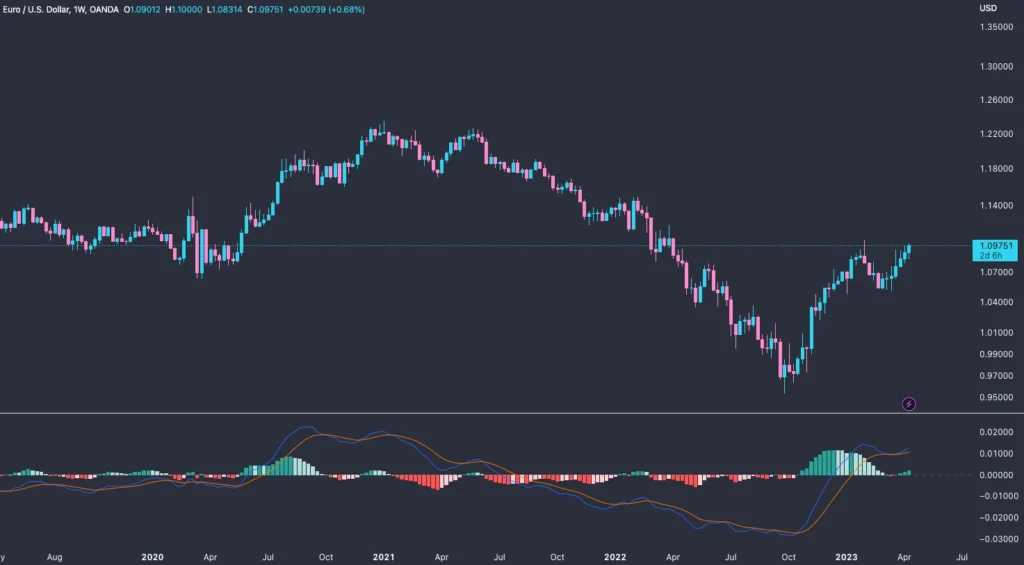
MACD (Moving Average Convergence Divergence): Tracking Market Trends
The MACD stands as a popular trend-following momentum technical indicator. It consists of the MACD line (obtained by subtracting the 26-day EMA from the 12-day EMA) and the signal line (a 9-day EMA of the MACD line). The histogram illustrates the difference between these two lines. Trading signals are generated from MACD line crossovers (occurring when the MACD line moves above or below the signal line) and divergences (when the asset’s price and the MACD lines shift in contrasting directions), providing insights into potential market movements.
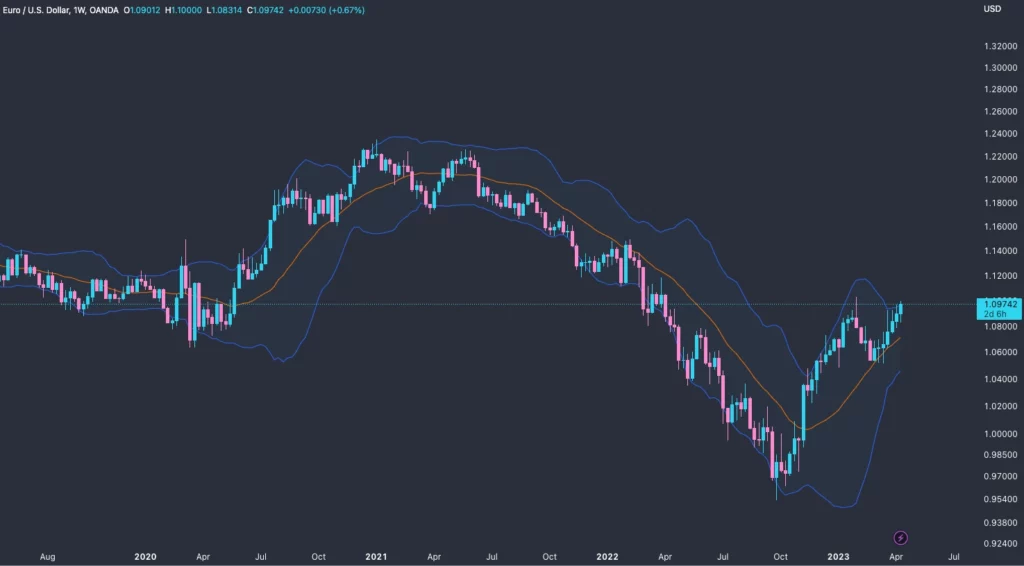
Bollinger Bands: Assessing Market Volatility
Bollinger Bands are essential for evaluating market volatility. Comprising a standard moving average and two deviation bands, they adjust with market volatility. Narrow bands indicate low volatility and potential price breakouts, while wider bands suggest increased volatility. By analyzing Bollinger Bands, traders can identify potential entry and exit points and recognize overbought or oversold conditions.
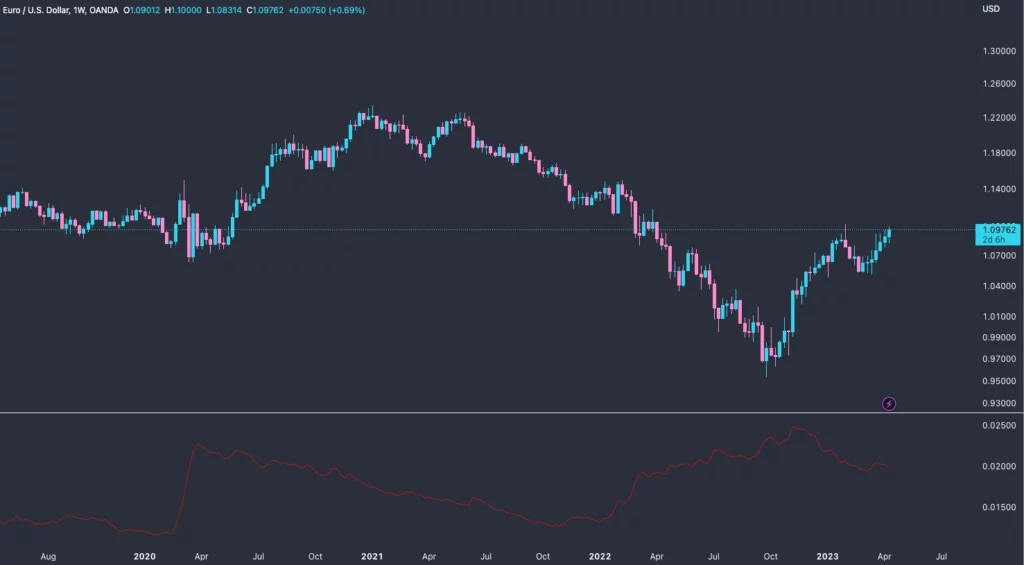
ATR (Average True Range): Understanding Market Volatility
The ATR is an invaluable volatility indicator, calculating the average price range over a period, typically 14 days. It helps traders assess market volatility, also set appropriate stop-loss and profit target levels. A high ATR value points to increased volatility, while a low value suggests less volatility, guiding traders in managing risk and adjusting position sizes according to current market conditions.
Conclusion: Enhancing Trading Strategies with Technical Indicators
To sum up, in order to improve decision-making and increase the probability of successful trades, it’s vital to comprehend and integrate top technical indicators such as Moving Averages, RSI, MACD, and Bollinger Bands into your trading strategy. By exploring these indicators more thoroughly and applying them in different market conditions, you will sharpen your trading skills and develop a more holistic approach to analyzing.
Article topics
Trade with E8 Markets
Start our evaluation and get opportunity to start earning.Suggested Articles:


Disclaimer
The information provided on this website is for informational purposes only and should not be construed as investment advice. Always conduct your own research and consult with a qualified financial advisor before making any investment decisions. We do not endorse or promote any specific investments, and any decisions you make are at your own risk. This website and its content are not responsible for any financial losses or gains you may experience.
Please consult with a legal professional to ensure this disclaimer complies with any applicable laws and regulations in your jurisdiction.