
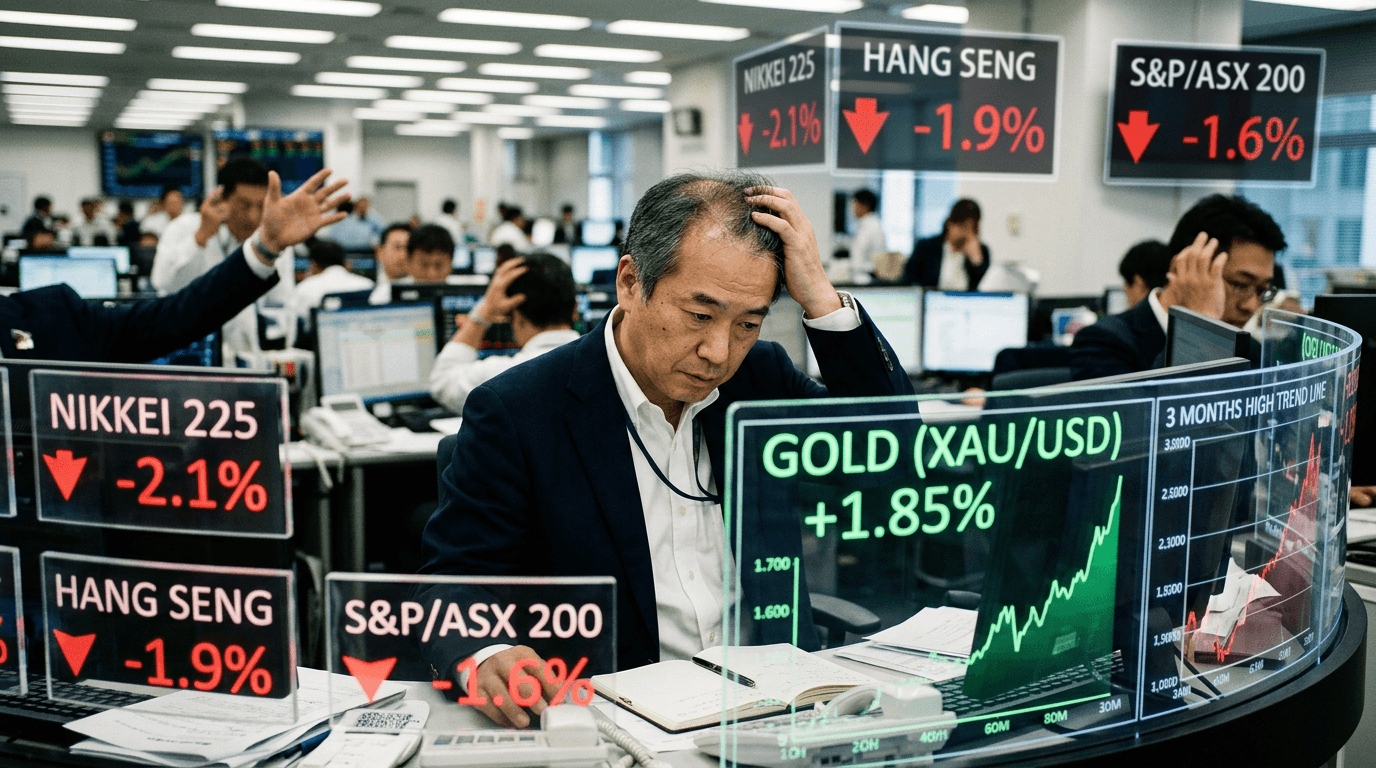
Asia-Pacific stocks opened the week on a cautious footing, with major benchmarks slipping as investors rotated into gold and other safe-haven assets, underscoring a clear risk-off tone across global markets.[12][8][13] For active traders, this combination of equity weakness and precious metal strength is a classic regime shift signal that can shape positioning for days, not just hours.
Risk-off Start To The Week
The risk-off narrative in Asia is being led by broad equity selling, with South Korea’s KOSPI index dropping as much as 3% intraday and Japan’s Nikkei trading modestly in the red.[12] These moves are notable because they follow weeks of choppy but generally resilient equity performance, suggesting that investors are now more willing to de-risk rather than simply buy dips.
Under the surface, the rotation is not just about price action but about perceived macro and policy uncertainty. Recent volatility in U.S. bond markets and renewed concerns about fiscal sustainability have already pushed global investors toward defensive assets.[8][13][15] Asia’s Monday open is simply the latest expression of this re-pricing of risk.
For traders, a session that opens with broad equity weakness and elevated volatility is a cue to reassess beta exposure. Index-linked strategies, leveraged products, and single-name positions tied closely to global growth or high-duration valuations are generally the most vulnerable in early-stage risk-off episodes.
GOLD’S SAFE-HAVEN SIGNAL
The strongest confirmation of the risk-off tone is coming from gold, which surged to a volatile three-month high above $4,630–$4,680 per ounce before quickly pulling back around $50.[8][13] That pattern—a sharp spike to multi-month highs followed by a fast retracement—is typical when hedging flows meet short-term profit-taking and options-related positioning.
This latest leg higher builds on a broader rally that has already pushed gold above key technical and psychological levels in 2026, including records north of $5,100 as geopolitical risk and policy uncertainty intensified earlier in the year.[2][3][6] The metal’s resilience even after such a steep climb reflects its role as a core portfolio hedge rather than a pure speculative vehicle.
Fundamentally, the drivers remain familiar: a softer or volatile U.S. dollar, concerns over U.S. debt dynamics, and actions such as the Treasury’s expanded long-term bond buybacks that have pressured yields and raised questions about future policy paths.[8][13][15] Each of these factors reduces the opportunity cost of holding non-yielding assets like gold and supports safe-haven demand when equities wobble.
For traders on a simulated finance platform, gold’s intraday behavior offers a textbook case study. The initial breakout above recent resistance zones, followed by a sharp mean-reversion, highlights the importance of planning for both directional trades and volatility capture—using defined risk, clear profit targets, and awareness of key macro catalysts.
Equity, Fx And Futures Reaction
The risk-off tone is not contained to cash equities and gold. Index futures across regions have reflected the cautious mood, with investors using futures to hedge or quickly adjust exposure ahead of overlapping European and U.S. sessions.[12] When futures move in tandem with cash markets at the open, it often signals that the move is institutionally driven rather than purely retail.
FX positioning reinforces the same story. Safe-haven currencies tend to benefit when gold is bid and equity volatility rises, while higher-beta or carry-focused currencies can lag as funding flows reverse.[12] A weaker U.S. dollar has already played a role in gold’s three-month highs, suggesting that FX markets are simultaneously hedging rate and risk expectations.[8][13][15]
For equity traders, this cross-asset alignment matters. When stocks fall, gold rises, safe-haven FX strengthens, and index futures trade heavy at the same time, it points to a coherent macro regime rather than isolated sector news. That coherence increases the odds that the theme will persist beyond a single session and makes correlation and diversification analysis more meaningful.
What This Means For Simulated Traders
Simulated trading environments are designed precisely for moments like this, where multiple asset classes flash strong, simultaneous signals. On a SimFi platform such as E8 Markets, traders can explore scenario-based strategies without capital at risk, testing how portfolios behave when equity volatility spikes and gold trends higher.
One practical application is to build and compare different “risk-off baskets.” For example, a trader could simulate portfolios that combine short exposure to Asia-Pacific equity indices with long positions in gold and selected safe-haven currencies, then analyze drawdowns, Sharpe ratios, and maximum intraday losses across varying volatility regimes. Incorporating historical episodes—such as gold’s earlier surge above $5,100 amid geopolitical tensions—can provide context for current moves.[2][3][6]
Another useful exercise is stress testing equity-heavy strategies against repeated shocks similar to the KOSPI’s intraday 3% slide.[12] By running multiple simulations with different hedging overlays—index puts, volatility products, or partial rotation into defensives—traders can identify which approaches best contain risk during abrupt sentiment shifts.
Importantly, simulated environments allow traders to evaluate the behavioral side of risk-off markets. Rapid gold spikes followed by quick reversals can tempt overtrading or chasing moves at poor levels; structured practice helps develop discipline around entry criteria, position sizing, and exit rules when markets feel “urgent.”
Practical Takeaways For The Week
First, treat the Asia-Pacific equity pullback and gold spike as a coordinated risk-off signal rather than random noise. Broad equity weakness, multi-month highs in gold, and aligned FX and futures behavior suggest that investors are actively reallocating capital, not merely reacting to isolated headlines.[12][8][13]
Second, respect the volatility in both directions. Gold’s rapid move above $4,630–$4,680 followed by a $50 pullback shows that even “defensive” assets can deliver sharp swings intraday.[8][13] Risk management should be calibrated to the realized volatility of the instrument, not just its reputation as a safe haven.
Third, use cross-asset relationships as a map. Correlations between equities, gold, FX, and index futures are powerful clues about the underlying macro story. When they line up, strategies that integrate signals from multiple markets—rather than trading each in isolation—tend to be more robust.
Finally, leverage simulation to turn this week’s conditions into learning opportunities. Build and test risk-off playbooks, examine how hedges behave when volatility jumps, and challenge assumptions about diversification. The goal is not merely to predict the next move, but to design frameworks that remain resilient across many such episodes.
Conclusion
Asia-Pacific equities starting the week on the back foot while gold pushes to a volatile three-month high sends a clear message: global investors are prioritizing protection and liquidity over pure growth exposure.[12][8][13] Whether this risk-off phase proves brief or evolves into a deeper correction, traders who study the current cross-asset dynamics—and rehearse their responses in a simulated environment—will be better prepared for whatever comes next.