
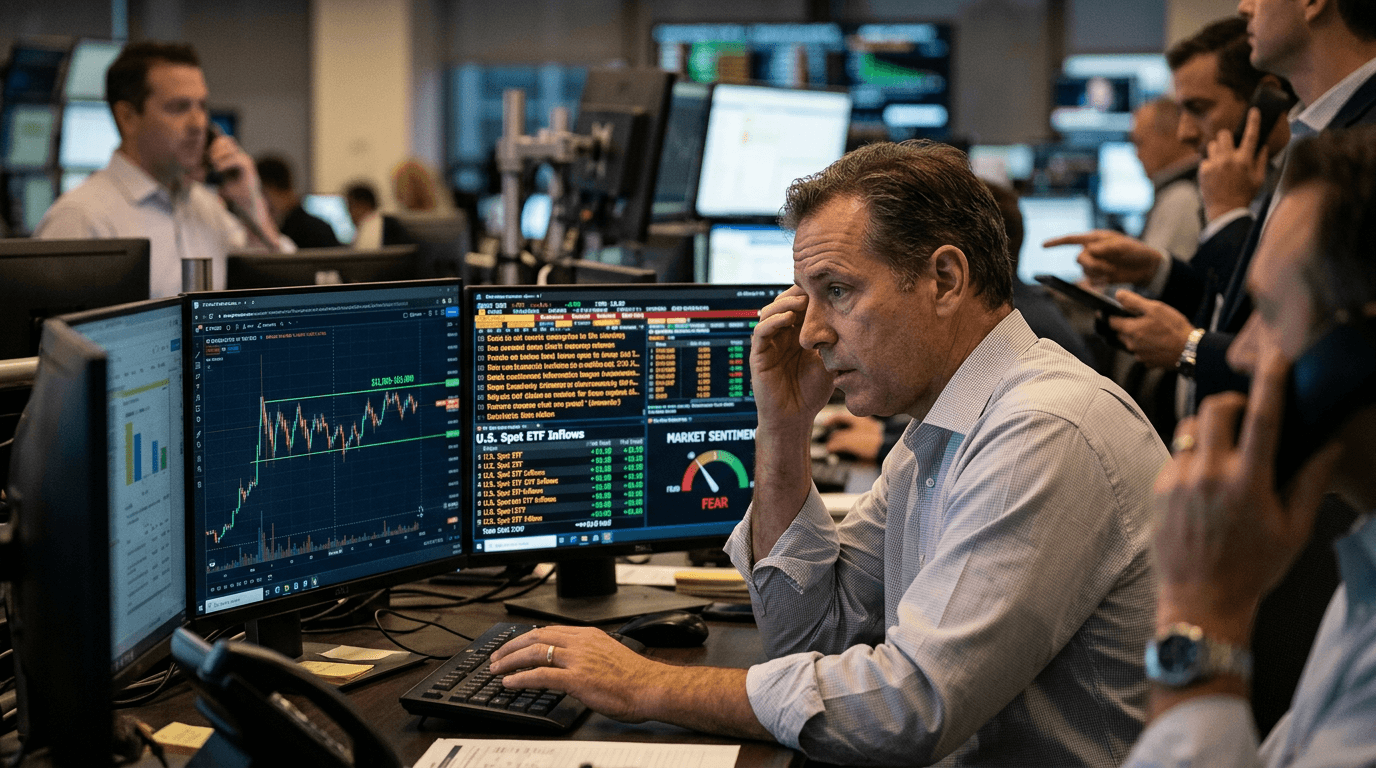
Bitcoin is back in a familiar holding pattern, trading in a tight range around $63,000–$65,000 after a volatile stretch that shook out some leverage but stopped short of a full risk-off capitulation.[1][5][12] Under the surface, however, flows into U.S. spot Bitcoin and Ether ETFs have quietly picked up, with roughly $1.1 billion in combined net inflows over a recent week—the strongest since April—signaling that institutional capital is still very much engaged.[1][10] At the same time, sentiment gauges remain stuck in “fear” territory, highlighting a market that is structurally supported but psychologically cautious.[13] For traders, this combination of range-bound price, strong ETF demand, and hesitant sentiment creates a nuanced environment where discipline and scenario planning matter more than aggressive predictions.
Market Range And What It Signals
Bitcoin’s tendency to consolidate in the low- to mid-$60,000s after sharp moves is not new; it reflects a tug-of-war between long-term buyers and short-term traders rebalancing risk.[1][5][12] During recent sessions, spot prices around $63,000–$65,000 have coincided with reduced intraday volatility compared with earlier spikes, suggesting that much of the fast money has already reacted to prior macro and tech-sector shocks.[5][12] Historically, such ranges can act as either accumulation zones for patient buyers or distribution zones where earlier longs lighten up—only visible in hindsight, but tradable in real time with clear risk limits.
For SimFi traders, this kind of environment is ideal for stress-testing range strategies, mean-reversion setups, and breakout plans without the emotional pressure of live capital. Practicing entries near the edges of the range and defining strict invalidation levels helps build the muscle memory required when volatility inevitably returns. The key is to treat the $63,000–$65,000 band not as a prediction but as a working reference point for scenarios: what happens if price repeatedly rejects the top of the range, or if a catalyst finally drives a convincing close above it?
Etf Inflows: The Quiet Institutional Bid
Beneath the sideways tape, U.S. spot Bitcoin and Ether ETFs have quietly posted one of their strongest weeks since April, drawing about $1.1 billion in combined inflows.[1][10] Spot Bitcoin ETFs alone absorbed more than $850 million over five sessions, with flows positive each day and one issuer accounting for the majority of the bid.[1][10] Ether products added over $240 million in the same period, marking their best weekly result since mid-April as well.[1]
These flows matter because they represent regulated, transparent demand—often from institutions and wealth platforms—that is less sensitive to short-term funding rates and more aligned with longer-term allocation themes. Sustained inflows help offset sell pressure from traders de-risking on exchanges and contribute to the “floor” that keeps Bitcoin anchored near current levels.[9][12] They also signal that, despite headlines about regulatory uncertainty or tech-sector volatility, capital allocators continue to view crypto exposure as part of a diversified portfolio rather than a passing fad.
For traders on simulated platforms, tracking ETF flows alongside price action is a powerful habit. Inflows paired with flat or drifting prices often indicate stealth accumulation, while outflows during rallies can hint at weakening underlying support. Building a simple routine—check ETF flow dashboards, cross-reference with spot and futures price behavior, then map potential scenarios—helps traders avoid being surprised by trend reversals that were telegraphed in the data.
Fearful Sentiment In A Supported Market
In contrast to the supportive ETF picture, sentiment indicators tell a more cautious story. A widely watched crypto Fear and Greed Index recently ticked up to 38, still firmly in “fear” territory and reflecting risk-averse behavior across major coins, volatility metrics, derivatives positioning, and stablecoin flows.[13] This suggests that, even as institutional products absorb net inflows, many traders remain wary after previous drawdowns and sharp intraday swings.
This divergence—money flowing in, psychology staying fearful—can be particularly instructive. Historically, fear in the face of resilient price action has often preceded medium-term recoveries, as pessimistic sentiment sets the stage for positive surprises when catalysts arrive. Conversely, it can also reflect justified caution if macro risks or regulatory headlines remain unresolved. The message is not that fear is “wrong,” but that it must be contextualized: are traders afraid while prices grind higher, or does fear accompany persistent lower lows?
For SimFi participants, this environment is an opportunity to practice trading against their own emotions rather than the market narrative. Simulated accounts allow traders to define rules that are robust to sentiment swings: for example, sizing positions based on volatility and structure rather than news tone, or requiring multiple independent signals (price, flows, macro) before increasing exposure. By rehearsing disciplined behavior in a simulated setting, traders are better prepared to avoid FOMO or panic when trading live.
Derivatives, Options And Perpetuals: Cautious Positioning
Even with spot ETFs seeing inflows, positioning in Bitcoin and Ether derivatives has been more cautious, with options skews and perpetual funding rates reflecting a defensive stance among traders. The persistence of fear in sentiment indices mirrors this caution, as many market participants prefer hedged or low-leverage exposure while the narrative remains mixed.[13] Periods like this often see increased interest in protective puts, range-bound strategies, and delta-neutral approaches rather than outright directional bets.
For educational and simulated trading, this is an ideal backdrop to experiment with structures that benefit from chop rather than trend. Examples include covered call overlays on long spot exposure, short-dated iron condors around well-defined ranges, or basis trades that exploit differences between futures and spot pricing. By testing these in a SimFi environment, traders can learn how options Greeks, funding, and margin dynamics behave when the market is neither clearly bullish nor clearly bearish.
Practical Takeaways For Traders
Rather than trying to guess the next $10,000 move, traders can focus on what the current mix of ETF inflows, range-bound price, and fearful sentiment actually offers:
1) Respect the range: Treat the $63,000–$65,000 zone as a working structure for planning, not a guarantee. Build simulated strategies for both breakouts and failed breakouts.
2) Watch the flows: Rising ETF inflows with stable prices often indicate accumulation; fading flows during a rally may warn of fragility.[1][9][10][12]
3) Use sentiment as a contrarian input, not a sole signal: Fear can persist even as structural demand improves, creating opportunities for patient positioning.[13]
4) Lean into practice over prediction: A SimFi platform lets traders test how they would respond if a macro shock pushes Bitcoin out of its range, or if a sustained inflow streak finally triggers a trend extension.
Conclusion
Bitcoin’s consolidation around $63,000–$65,000, backed by roughly $1.1 billion in recent ETF inflows yet shadowed by “fearful” sentiment, encapsulates the current crypto market: supported by structural demand, but hesitant in psychology.[1][10][13] For traders, this is not a dead zone; it is a live laboratory where range dynamics, flow analysis, and sentiment interpretation converge. Using simulated environments to explore strategies—rather than chasing every headline—helps build the discipline required to navigate the next decisive move, whether that is a breakout to new highs or a deeper reset that finally tests conviction.