
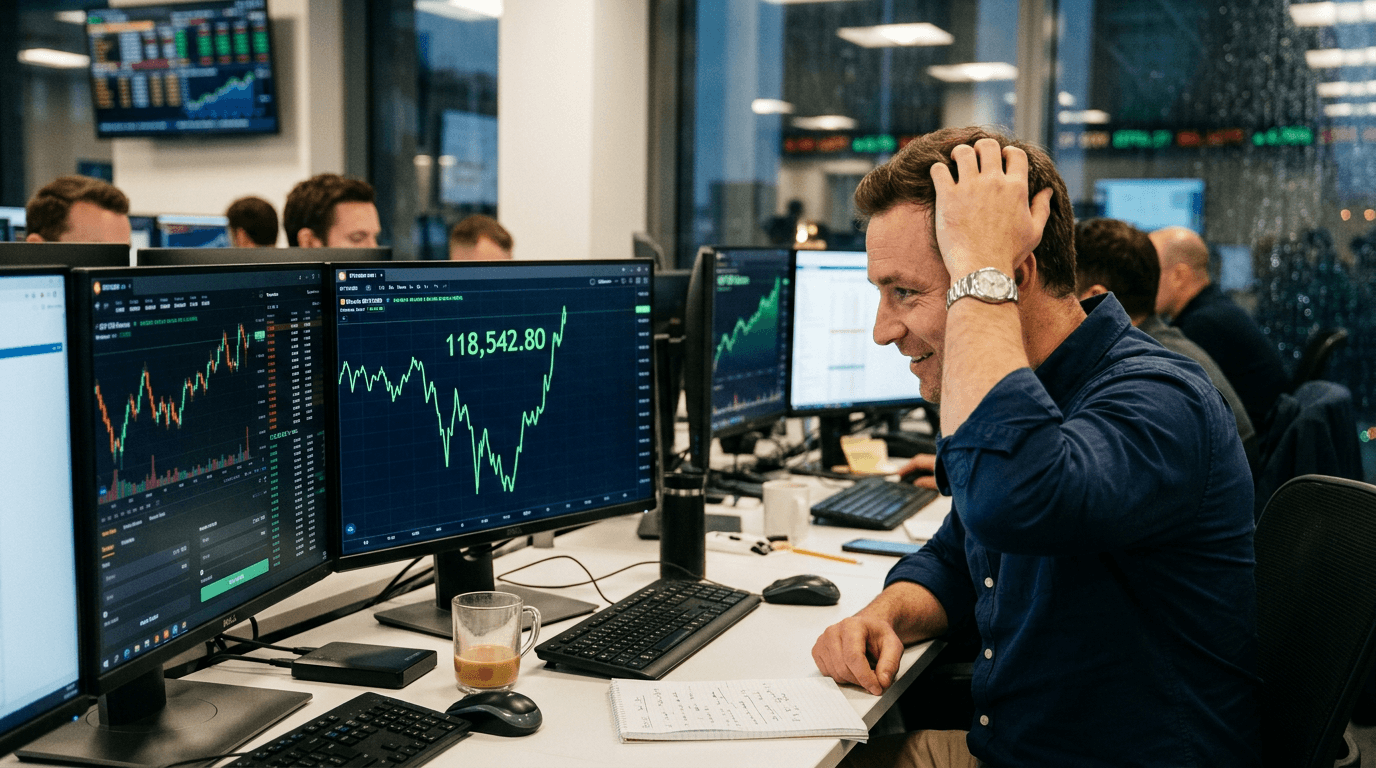
Bitcoin’s latest intraday reversal has once again reminded traders how quickly sentiment can shift in crypto. During the recent session, BTC briefly dipped below the $116,000 mark before buyers stepped in, driving price back toward the $118,000 region by the end of the day[16]. For active traders and SimFi participants alike, this kind of V-shaped recovery offers a live case study in liquidity, psychology, and risk management.
BITCOIN’S QUICK REBOUND: WHAT HAPPENED
The session began with lingering sell pressure from earlier in the week, as Bitcoin continued to digest profit-taking after printing fresh record highs near $120,000–$123,000[3][6]. The intraday move lower pushed BTC beneath $116,000, briefly challenging short-term support and triggering stops for late longs who had chased the prior rally[16].
On-chain and order-flow data suggest that, rather than triggering a deeper cascade, the dip attracted aggressive buying interest. Analysts have noted that roughly 196,600 BTC was accumulated in the $116,000–$118,000 band following the recent correction, signaling that both institutional and large retail players view this area as attractive value rather than a topping zone[3]. As bids absorbed supply, price rebounded and reclaimed the $118,000 level, turning what looked like the start of a deeper pullback into a textbook liquidity grab[6].
Key takeaway: Intraday dips in strong uptrends often represent liquidity events rather than trend reversals, and the speed of Bitcoin’s rebound highlights how quickly deep-pocketed buyers are stepping in around perceived value zones.
WHY THE $118,000 LEVEL MATTERS
The recovery is notable not just because of the magnitude of the bounce, but because of where it stalled and stabilized. Several on-chain and technical analysts have pointed to $118,000 as a decisive threshold for the current cycle[16]. It aligns with the region of the 70-day simple moving average (SMA), as well as with key realized-value and MVRV (Market Value to Realized Value) metrics that help gauge whether the market is extended or still in healthy expansion[16].
In practice, reclaiming and holding above $118,000 serves as a signal that the prior correction was a pause rather than a phase transition into a sustained downtrend. It is also a psychologically important number: round figures near all-time highs typically attract both speculative interest and media attention, reinforcing feedback loops in sentiment. When BTC trades above such a threshold, traders tend to position for continuation toward the next major liquidity cluster, which some data providers currently place near $120,500[6].
Key takeaway: $118,000 is more than just a round number; it is a technical and psychological pivot. Maintaining price action above it keeps the door open for another leg higher and anchors bullish market structure.
Impact On Risk Sentiment And Other Markets
Bitcoin’s quick reclaim of $118,000 has implications beyond crypto spot markets. When BTC bounces sharply after testing support, it often reinforces risk-on appetite across a wide range of assets, from altcoins to equity index futures. During this rebound, major cryptocurrencies such as Ethereum, XRP, and Solana also turned higher, suggesting that traders view the move as confirmation that the broader digital asset bull phase remains intact[1][10].
This change in tone can spill over into traditional markets. For many macro participants, Bitcoin now functions as both a speculative risk proxy and a barometer of liquidity conditions. A swift recovery from an intraday dip can encourage traders to re-engage in higher-beta plays across equity sectors, emerging market FX, and even commodity-linked futures, particularly when it coincides with supportive institutional flows and improving regulatory headlines[3][18]. Conversely, a failure at such levels would likely have reinforced defensive positioning in dollar strength, low-volatility pairs, and short-term government bonds.
Key takeaway: Bitcoin’s resilience above $118,000 tends to brighten overall risk sentiment. For multi-asset traders, monitoring BTC around such inflection points offers an additional lens on when markets might pivot from caution back toward risk-taking.
Lessons For Traders And Simulated Finance Participants
For those trading live capital and those practicing in SimFi environments, this move offers several practical lessons. First, strong trends routinely produce sharp counter-moves. The intraday break below $116,000 would have looked like the start of a deeper correction to many traders sitting on unrealized gains[16]. However, traders using structured playbooks—such as pre-defined support zones, automatic scaling-in rules, or volatility-adjusted position sizes—were better positioned to treat the move as an opportunity rather than a threat.
Second, on-chain and positioning data are increasingly central to modern crypto analysis. Seeing large accumulation in the $116,000–$118,000 band[3] helps traders contextualize price action: were they selling into a vacuum, or into strong demand from long-term holders? Simulated environments are ideal for testing how these metrics can be incorporated into strategies—whether as filters for trend-following systems, as confirmation tools for breakout trades, or as risk signals for de-leveraging around overheated zones.
Third, intraday volatility underscores the importance of disciplined risk management. Traders who were over-leveraged into the dip may have been forced out right before the recovery. In contrast, those who sized positions according to volatility and set stop-losses down the structure—not directly beneath the most obvious level—had more room to withstand noise and participate in the subsequent bounce.
Key takeaway: Use simulated trading to rehearse responses to sharp intraday moves. Integrate on-chain, technical, and volatility signals into your process so that you can distinguish between normal pullbacks and genuine structural breaks.
What To Watch Next
With Bitcoin back near $118,000, the focus now shifts to whether it can convert this threshold from a contested zone into a firm base for the next advance. Traders will be watching several factors:
Institutional flows: Sustained buying from funds, corporates, and ETF-related vehicles has been a key driver of recent uptrends[3][7]. Continued inflows would support the case for a push toward the next resistance band around $120,000–$121,000.
Macro catalysts: Central bank communication, inflation data, and regulatory developments around digital assets remain significant swing factors. Recent episodes have shown that hawkish commentary can trigger sharp profit-taking, while any indications of policy stability or supportive legislation tend to re-energize crypto demand[1][3][16].
Market structure: If BTC starts building higher lows above $116,000 while defending $118,000 on closing bases, the pattern will reinforce the narrative of a strong, ongoing bull cycle[6][15]. However, repeated rejections at this level, especially on rising volume, would raise the odds of a deeper mean reversion toward lower support zones identified by technical analysts.
For traders, this environment demands both flexibility and preparation. Using simulated finance platforms to test scenarios—Bitcoin breaking cleanly through $118,000, failing and rotating lower, or chopping sideways under decreasing volatility—can help refine strategies before capital is at risk. The current backdrop rewards those who can blend macro awareness, on-chain insight, and disciplined execution.
Key takeaway: The reclaim of $118,000 is a constructive signal, but the next sessions will determine whether it marks a launchpad or merely a pause. Staying prepared for multiple outcomes is essential in a market where intraday sentiment can turn on a dime.