
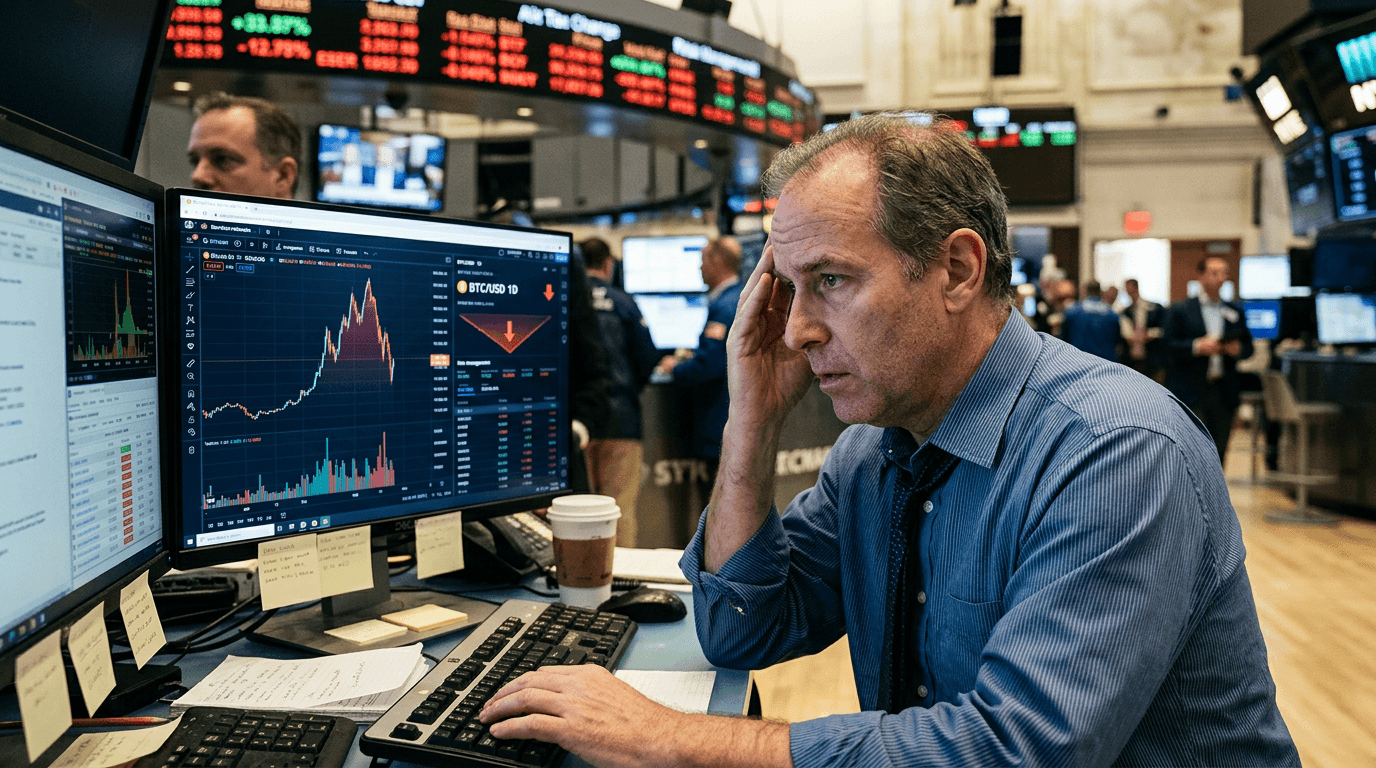
Bitcoin’s latest surge above $81,000 and rapid intraday reversal is a textbook example of how quickly sentiment, liquidity, and positioning can shift in the crypto market. After pushing toward $82,000 and holding above $81,000 for a brief window, heavy profit-taking dragged prices back into the high-$78,000 to low-$79,000 zone, turning what looked like a breakout into a volatile range trade. For traders, this move is less about a single price print and more about what it reveals: crowded positioning, strong ETF-driven demand, and fragile short‑term conviction.
Market Move: Spike, Reversal, And Volatility
Bitcoin’s rally to a multi-month high above $81,000 came after a powerful run from the mid-$60,000s in a matter of days, one of the fastest weekly advances in several years.[6][10][15] That kind of vertical move tends to leave the market vulnerable because both longs and shorts are highly leveraged and reactive.
As price pushed through the psychologically important $80,000 level and briefly extended above $81,000, intraday volatility jumped across major crypto pairs, with rapid swings in altcoins and Bitcoin dominance ticking higher.[1][5][10] The subsequent slide back below $80,000 and into the $78,000–$80,000 band transformed that area into a near‑term support zone, where buyers who missed the initial breakout are now meeting sellers looking to lock in gains.[14][15]
For active traders, the key takeaway is that sharp, news‑driven rallies in Bitcoin often resolve into choppy, mean‑reverting price action rather than clean continuations. Recognizing when a breakout is morphing into a range can help avoid chasing late entries at stretched levels.
WHAT DROVE THE SURGE ABOVE $81,000?
The move above $81,000 was not purely speculative; it was backed by renewed institutional demand through U.S. spot Bitcoin ETFs and a broader “debasement trade” narrative tied to Treasury market interventions.[1][3][10] These ETFs have become a primary bridge for traditional investors seeking Bitcoin exposure without managing on‑chain holdings, so large net inflows can quickly translate into spot buying and price acceleration.
At the same time, macro conditions have helped. A softer U.S. dollar, concerns about long‑term debt sustainability, and Treasury bond buyback plans have pushed some investors toward alternative stores of value, with Bitcoin positioned as a high‑beta hedge against currency debasement and bond market volatility.[5][6][10] That backdrop amplified the impact of ETF flows, creating a feedback loop where rising prices attracted more inflows, which in turn drove prices higher.
Derivatives markets also played a role. As Bitcoin approached and broke above $80,000, forced short covering and the unwinding of leveraged positions added fuel to the rally, contributing to the rapid ascent toward $81,000 and beyond.[3][8][15] When that forced buying subsided and spot demand cooled, price lost momentum, setting the stage for the intraday reversal.
From Euphoria To Intraday Reversal
The reversal from above $81,000 back toward the high-$78,000s reflects classic overbought conditions. Momentum indicators such as the relative strength index (RSI) flagged an overextended market, and resistance near prior range highs encouraged traders to take profits rather than add new risk at elevated levels.[14][15]
Once selling started, it was amplified by short‑term holders and leveraged traders protecting recent gains. Many who entered the market during the move from $70,000 to $80,000 were sitting on double‑digit percentage profits, making even modest pullbacks an attractive opportunity to de‑risk.[14][15] This profit‑taking is healthy in the context of a larger uptrend, but it can feel violent for intraday traders as price swings of several thousand dollars occur within hours.
For longer‑term investors, the intraday reversal is less alarming than it appears on a one‑minute chart. Bitcoin remains well above levels seen before the breakout, and the move has helped push total crypto market capitalization back toward the $2.8 trillion area, rebuilding value lost during the 2022 bear market.[5][13] However, it does underline that even structurally bullish narratives can produce sharp, short-term drawdowns.
Key Levels And Scenarios To Watch
In the near term, the $78,000–$80,000 band has emerged as a key support zone, where dip buyers are likely to test their conviction.[14][15] A sustained hold above this area would suggest that the recent rally is consolidating rather than reversing, potentially setting up another attempt at the $81,000–$82,000 region.
Above, the $80,000–$82,000 band now acts as resistance, reflecting a zone where overbought signals triggered profit‑taking and where trapped late buyers may look to exit on any retest.[14][15] A clean breakout and daily close well above this cluster, supported by solid spot and ETF inflows, would re‑open the path toward prior highs.
On the downside, a decisive break below $78,000 with rising volumes would indicate that short‑term sellers have regained control. In that scenario, traders would likely look toward the mid‑$70,000s and prior consolidation zones as the next potential demand areas. Whichever path unfolds, volatility is likely to remain elevated as options markets reprice and leveraged positions adjust.
HOW TRADERS CAN RESPOND – AND PRACTICE IN SIMFI
For discretionary traders, the recent spike and reversal highlight several practical lessons. First, vertical rallies backed by strong flows can continue longer than fundamentals alone might justify, but they also demand tighter risk management and clear exit rules. Entering late into a parabolic move without a defined stop or plan for partial profit‑taking is one of the fastest ways to turn a winning trend into a losing trade.
Second, using levels like $78,000–$80,000 as reference points rather than hard lines can improve decision‑making. Markets often “test” zones with brief dips or spikes, and simulated trading environments allow traders to experiment with different entry and exit triggers around these ranges to see what works best for their style.
SimFi platforms such as E8 Markets give traders the opportunity to replay volatile sequences like the $81,000 breakout and reversal, stress‑test strategies under extreme conditions, and refine rules for sizing, hedging, and de‑risking without putting capital at risk. Practicing how to respond when price suddenly moves thousands of dollars in either direction can make real‑world trading more disciplined and less emotional.
Conclusion
Bitcoin’s brief spike above $81,000 and sharp intraday reversal encapsulate the current state of the crypto market: structurally supported by institutional flows and macro narratives, but still dominated by fast money and high leverage in the short term. For traders and investors, the message is clear. Respect the trend, but respect the volatility even more. Understanding how ETF inflows, macro shifts, and positioning interact around key levels will be crucial as Bitcoin navigates this new, higher‑priced regime—and simulated trading offers a powerful way to build that understanding before committing real capital.