Major cryptocurrencies are catching their breath after a modest pullback, with Bitcoin, Ethereum, and XRP holding above key support levels even as geopolitical tensions and shifting central bank expectations cloud the outlook. Traders are watching these “last lines of defense” closely, knowing that whether supports hold or break could set the tone for the next major move in digital assets.
Markets Pause At Critical Support
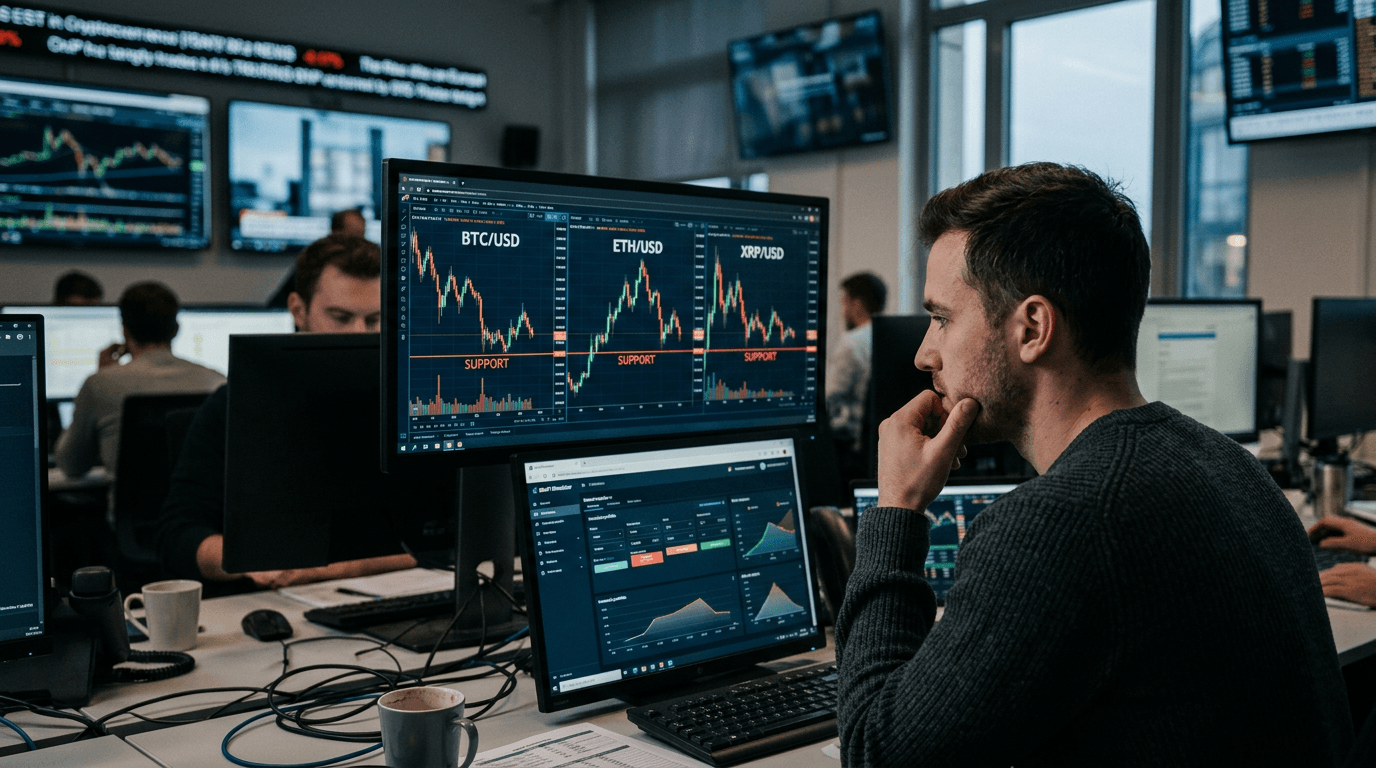
After roughly a 2% decline across leading coins, price action has turned cautious rather than panicked. Bitcoin, Ethereum, and XRP remain above areas where buyers have previously stepped in aggressively, suggesting that dip-buying interest is still present, but more selective than during the last risk-on phase.
This kind of behavior is typical around support levels: price falls into a zone where demand historically outweighs supply, often prompting a pause, consolidation, or a bounce.[4][6] These areas act like temporary “floors” for the market, slowing or halting declines when traders decide that the new, lower prices represent value.[4]
In the current environment, that “value” calculation is complicated by two overlapping forces: escalating geopolitical risks tied to the Iran conflict, and evolving expectations around future Federal Reserve policy. Both can quickly change volatility, liquidity, and risk appetite across all asset classes, and crypto traders are responding by tightening risk rather than exiting markets altogether.
What Key Support Levels Tell Us
Support and resistance levels are among the most widely used tools in technical analysis, particularly in volatile markets like crypto. Support is a price level where an asset tends to stop falling because buying pressure becomes strong enough to absorb selling.[3][4] Resistance is the opposite: a “ceiling” where selling pressure typically overwhelms demand and caps rallies.[4][6]
For major cryptocurrencies, key support levels often form around:
- Previous swing lows on the chart, where prior selloffs found a bottom.[4][6]
- Round numbers that attract psychological and algorithmic attention (for example, levels like $60,000 in Bitcoin).[6]
- Areas where price has repeatedly bounced, retested, and reversed, building a track record as a barrier to further declines.[4][5]
Technical guides emphasize that these levels are not fixed prices, but zones where supply and demand have historically met and caused turns in the market.[10] Traders identify them by studying historical price data, plotting it on charts, and marking levels where price has repeatedly struggled to move beyond.[3][5][6] The more touches and reversals at a given zone, the more “established” that support or resistance becomes.[4]
When Bitcoin or Ethereum grinds down into such an area and then starts moving sideways instead of cascading lower, it often signals that participants are reassessing risk, adjusting positions, and waiting for new information before committing to a direction. That’s exactly the tone of today’s market: cautious, data-dependent, but still respecting technical structures.
Geopolitical Risk And Crypto Sentiment
Geopolitical shocks like the Iran conflict tend to ripple through all risk assets, and crypto is no exception. When headlines turn more threatening, traders worry about funding markets, global growth, and potential policy responses—factors that feed into appetite for speculative positions, leverage, and futures exposure.
In such periods, risk management usually tightens first, before wholesale liquidation occurs. That can mean:
- Reducing leverage in perpetual futures while keeping core spot holdings.
- Narrowing position sizes and bringing stops closer to support levels.
- Rotating into more liquid, large-cap coins like BTC and ETH, which often act as “relative havens” within crypto.
The intersection of geopolitical stress with changing expectations around the Federal Reserve adds another layer. If traders believe rates could stay higher for longer, the appeal of long-duration, speculative assets can fade at the margins. Conversely, any hint of future easing can offset geopolitical worries, supporting risk sentiment.
This push-and-pull helps explain why markets are not collapsing through support, but also not aggressively bouncing. Futures positioning and options markets often show traders hedging downside while keeping optionality for an upside resolution if tensions ease or policy turns more supportive.
Trading Around Supports In Uncertain Times
For active traders, key support zones become focal points for strategy—especially when macro risks are elevated. Practical approaches drawn from support-resistance playbooks include:
- Waiting for confirmation: Rather than buying the first touch of support, many traders look for signs of stabilization such as smaller candles, declining volume on down moves, or clear rejection wicks at the level. This aligns with the idea that strong support is often marked by repeated tests and reversals rather than a single bounce.[3][4]
- Planning entries and exits around structure: Educational resources highlight that support and resistance zones can provide natural entry and exit points for trades.[3][5] Buying slightly above support with a stop-loss just below it can offer a defined risk profile; if support fails, the trader is quickly out, and if it holds, there is room for upside toward resistance.[3][5]
- Respecting that supports can eventually “wear down”: Support and resistance levels absorb buy and sell pressure but will often be broken after multiple tests as order flow thins.[4] In a geopolitically charged environment, traders must be ready for the possibility that a widely watched level fails on a surprise headline, triggering a fast repricing.
Educational guides also stress the importance of zooming out beyond short-term noise, connecting 2–3 key lows with a trendline to visualize the broader support structure.[3][6] When price is still above that longer-term trendline, corrections into support may be framed as pullbacks within an uptrend rather than full-scale reversals.
Implications For Simulated Finance Traders
For SimFi traders, this environment offers a valuable live case study in how macro risk, sentiment, and technical levels interact. Because portfolios are simulated rather than real, traders can experiment with:
- Designing playbooks for trading around support and resistance: Using historical data to identify zones, plotting them on charts, and then testing different entry/exit tactics as price interacts with these levels.[3][5]
- Stress-testing risk plans against geopolitical scenarios: Running simulated strategies that assume support holds versus breaks under new headlines, and observing how position sizing, leverage, and stop placement affect outcomes.
- Comparing trend-following versus mean-reversion approaches: When price sits near support, some strategies bet on a bounce, while others wait for a breakdown and then ride momentum lower. SimFi environments allow traders to test both styles without capital at risk, building intuition for which approaches fit their temperament and time horizon.
Ultimately, the current cautious trade near key supports is a reminder that crypto markets are shaped by both charts and headlines. Technical “floors” still matter, but they exist within a macro backdrop that can change quickly. Simulated trading provides a safe way to learn how to navigate that complexity—so when the next real-world shock arrives, traders are prepared to respond with a structured plan rather than emotion.