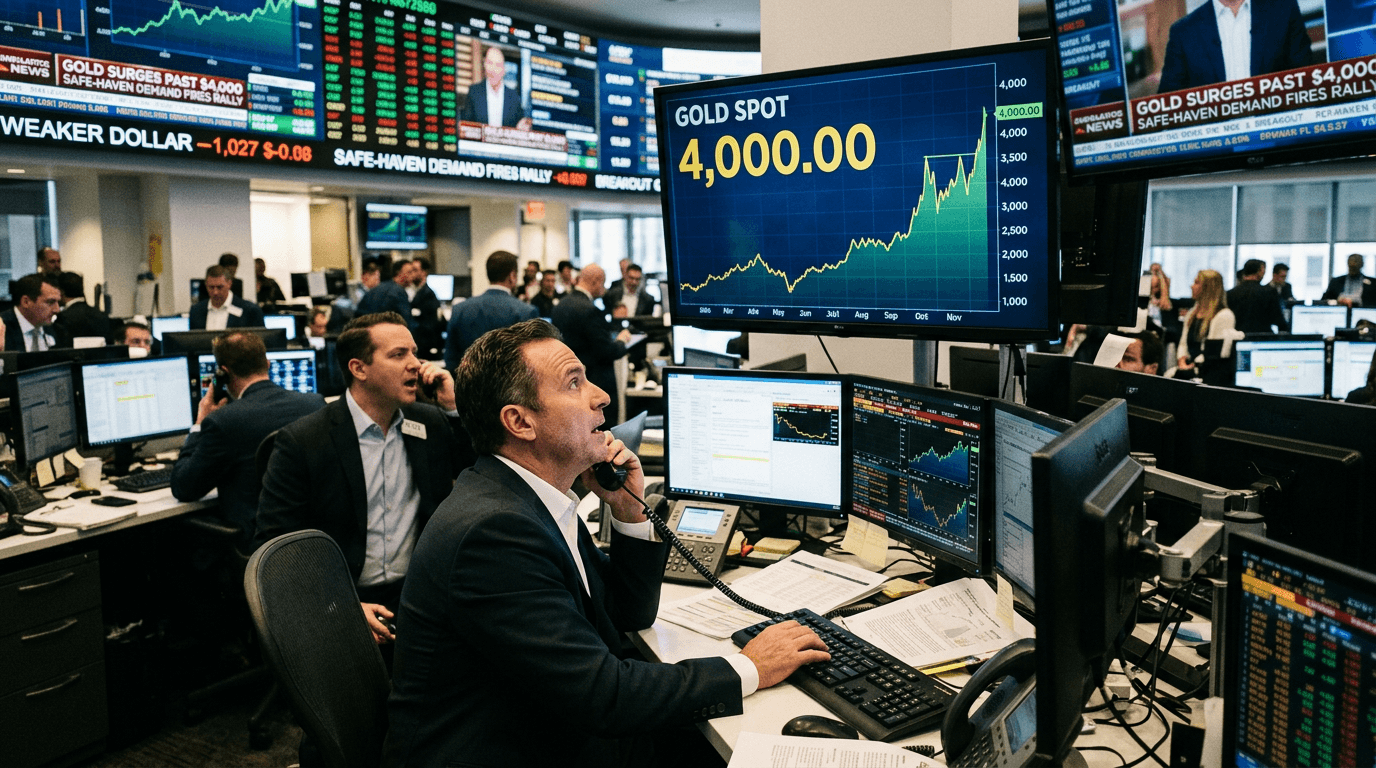
Gold has vaulted back above the psychologically critical $4,000 an ounce level, rekindling one of the most closely watched trades in global markets. Spot XAU/USD has jumped more than 2% to reclaim this zone as investors seek shelter from renewed geopolitical tensions, persistent inflation worries, and a sharp drop in the U.S. dollar. The move is pulling futures higher, pressuring real yields, and reigniting demand across the broader precious metals complex.
Safe-haven Demand Returns
Gold’s latest breakout is fundamentally a story of safe-haven demand coming back into focus. For much of the recent rally, investors have used gold as insurance against policy uncertainty, elevated government deficits, and doubts about the long‑term stability of the dollar and U.S. Treasurys.[3][4] In periods of heightened anxiety, capital tends to rotate away from risk assets and toward stores of value, and gold remains the most liquid and widely recognized of these havens.[4]
This surge above $4,000 is not happening in isolation. Over the past year, gold prices have already climbed roughly 50%, outpacing many major equity benchmarks and signaling that risk hedging, rather than pure speculation, is driving flows.[2][3][4] Large gold‑backed exchange‑traded funds have accumulated substantial tonnage, with one major bank reporting more than 100 metric tons added in a single month during a prior phase of the rally.[4] That kind of institutional and sovereign participation reinforces the notion that gold is being treated as a strategic reserve asset, not just a short‑term trade.[4]
Analysts have described much of this demand as part of a “debasement trade”: investors buy gold to protect themselves from the erosion of confidence in fiat currencies and the growing weight of public debt.[3] When worries about government shutdowns, geopolitical flashpoints, or central bank autonomy flare up, gold tends to benefit as market participants question the resilience of traditional safe havens like the dollar and long‑dated bonds.[3][4]
Weaker Dollar And The Macro Backdrop
The other key driver behind gold’s move is the pronounced weakening of the U.S. dollar. In earlier stages of this rally, the dollar index fell around 10% over the year, making dollar‑priced gold more attractive for foreign buyers and signaling that currency markets were pricing in lower real returns from U.S. assets.[2] A fresh, steep drop in the dollar amplifies that dynamic: as the greenback falls, investors have both a defensive and opportunistic reason to rotate into gold.
Gold’s appeal is tightly linked to real yields—the inflation‑adjusted return on safe fixed‑income assets. When nominal interest rates fall or inflation expectations rise, real yields tend to compress, diminishing the relative attractiveness of holding cash or government bonds and boosting gold, which does not pay interest but also does not carry credit risk.[2][3] Recent policy uncertainty has reinforced expectations that central banks may need to stay flexible, or even cut rates again, if growth slows or financial stress intensifies.[2][3]
This interplay was visible when the Federal Reserve previously lowered interest rates, helping launch gold to its first push beyond $4,000.[2] Later, as a more hawkish Fed stance and a stronger dollar emerged, gold briefly slipped below that threshold, signaling a less supportive macro environment.[7] The latest breakout back above $4,000 suggests that the balance of forces has shifted again: markets are once more emphasizing risk hedging and currency weakness over yield‑seeking behavior.[3][7]
TECHNICAL LEVELS AND POSITIONING AROUND $4,000
From a technical perspective, the $4,000 area is both a landmark and a battleground. The initial move through this level marked an all‑time high in futures, with intraday prices surpassing $4,014 before settling slightly lower.[2][3] Such round numbers often act as psychological magnets, attracting momentum traders and reinforcing fear of missing out. That FOMO has been cited as one reason why inflows into gold ETFs surged as prices broke out.[3]
Analysts have highlighted key support zones below the market, such as the 20‑day moving average around $3,715 and the 50‑day moving average near $3,515.[3] In previous pullbacks, a sustained break under these levels was seen as a signal that the rally might be entering a deeper correction.[3] By contrast, the current push back above $4,000 indicates buyers are willing to defend higher ground, with the prior dip below this threshold now looking more like a macro shakeout than the end of the trend.[7]
For traders, that means the $4,000 area has shifted from being simply a resistance level to a pivot: how price behaves around this zone—whether it consolidates, extends higher, or quickly reverses—will shape positioning across futures, options, and gold‑linked ETFs.
How Simulated Traders Can Navigate The Move
On a SimFi platform, this kind of gold breakout offers a rich environment to practice multi‑factor trading strategies without real‑world risk. One practical approach is to treat XAU/USD as a macro barometer: build scenarios that link gold’s path to the dollar index, real yields, and key geopolitical headlines, then test how different combinations of these drivers might affect price.
Traders can experiment with trend‑following strategies that use moving averages around the $3,700–$3,500 zone as dynamic support and the $4,000 mark as a structural pivot.[3] For instance, a simulated strategy might stay long gold while it holds above its 20‑day moving average and the dollar remains under pressure, but reduce exposure if price loses that support at the same time as real yields start rising.[3][7] This reinforces the discipline of linking technical signals to macro context rather than trading levels in isolation.
Risk management is equally important to practice. The fact that gold previously fell below $4,000 when the Fed turned more hawkish and the dollar strengthened underscores how quickly narratives can change.[7] In simulation, traders can design position‑sizing rules that adapt to volatility—reducing size after large daily moves, using stop‑losses around key moving averages, or hedging gold exposure with positions in related assets such as silver or mining indices.
Key Takeaways For Precious Metals Markets
Gold’s surge back above $4,000 reflects a powerful combination: revived safe‑haven demand, a weaker dollar, and renewed concern about inflation and policy uncertainty.[2][3][4] The move is drawing capital into other precious metals and reinforcing gold’s role as both a tactical hedge and a strategic reserve asset for institutions and sovereigns.[3][4] With some banks now projecting prices could approach $4,900 by the end of next year if current drivers persist, gold is firmly back at the center of the macro conversation.[3][6]
For traders and investors—real and simulated—the message is clear. Gold is not just another commodity; it is a live readout of market anxiety, currency confidence, and expectations for real returns. Understanding why it breaks out, how it behaves around critical levels, and what macro forces sit behind the chart is essential for navigating the next phase of this historic move.