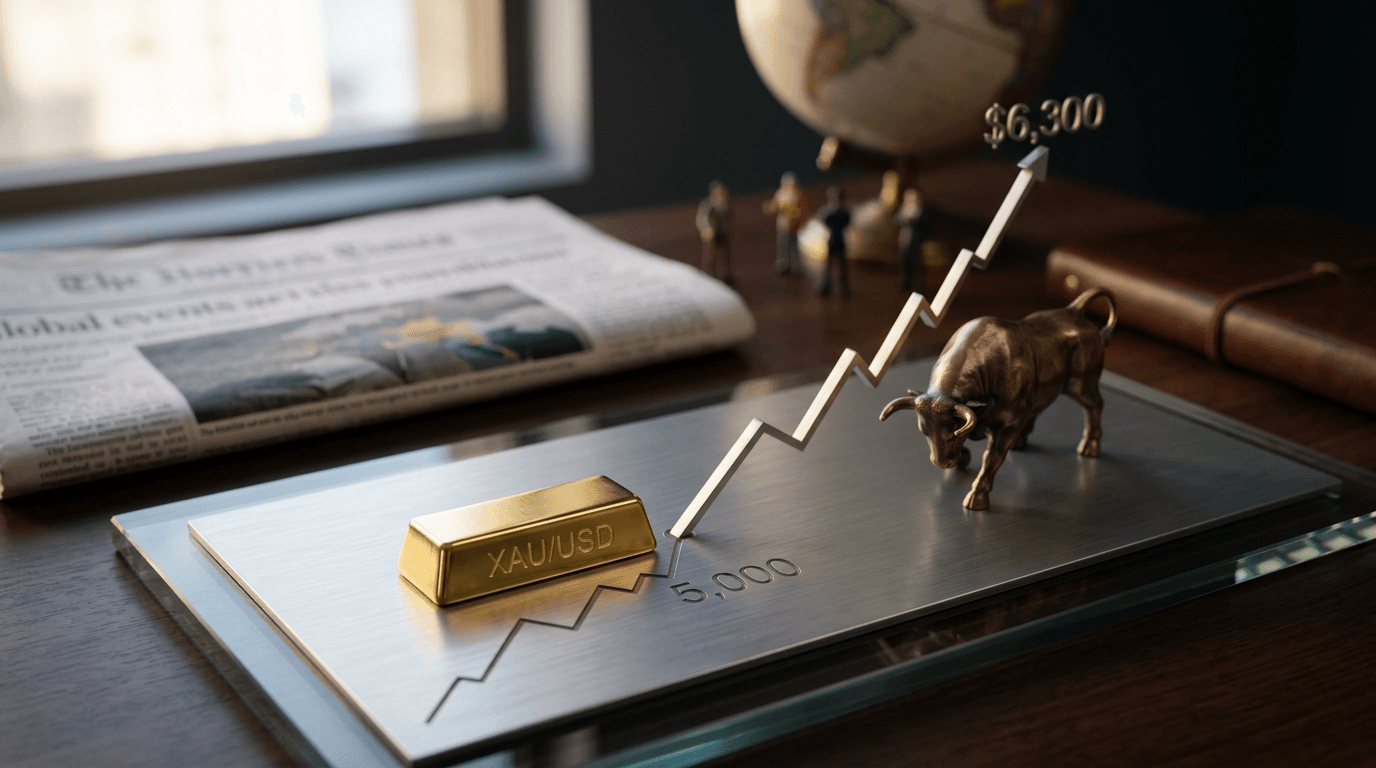
Gold has staged a remarkable recovery in early March 2026, demonstrating the metal's enduring appeal as a safe-haven asset during times of geopolitical uncertainty. After experiencing a brief 4% correction in the opening days of March, XAU/USD found critical support near the $5,000 level, a development that has caught the attention of traders and institutional investors alike. The resilience shown at this key technical level suggests that despite short-term volatility, the underlying bullish momentum remains intact. With prices currently hovering in the $5,100-$5,200 range and multiple analyst targets pointing toward new highs, the question for investors is not whether gold will continue its advance, but rather how quickly it might reach those projected price levels.
THE $5,000 SUPPORT LEVEL: A TECHNICAL TURNING POINT
The $5,000 support zone represents far more than just a round number on the price chart. According to technical analysis of the market, this level corresponds to the 50% Fibonacci retracement level, a mathematically significant point that frequently acts as a magnet for price action during corrections and consolidations. When gold dropped to test this support level during the early March turbulence, it demonstrated institutional demand at precisely the level where buyers were positioned. The recovery from these lows signals that bears lacked the conviction to break decisively below this critical floor, a textbook signal of underlying strength in the market.
Moving average analysis further reinforces the bullish case. Gold's price structure remains comfortably above a cluster of rising moving averages—the 20-day, 50-day, 100-day and 200-day simple moving averages—all of which are aligned in bullish formation. This technical setup suggests that the prevailing trend remains upward despite the periodic corrections that are normal in any strong rally. The proximity of support near $5,000 combined with resistance appearing around $5,350-$5,450 creates a well-defined trading range that many participants view as a launching pad for the next leg higher.
Why Geopolitical Tensions Are Fueling Gold Demand
Safe-haven flows resulting from Middle East tensions represent the primary catalyst propelling gold higher in 2026. When geopolitical risks escalate, investors and central banks alike shift capital into assets perceived as secure stores of value. Gold, with its millennia-long track record as a crisis hedge, invariably benefits during such periods. The combination of economic uncertainty and headline risk from international tensions creates precisely the environment in which gold thrives. This dynamic has been evident throughout early 2026, as central banks have continued accumulating gold at a robust pace while individual investors have piled into gold exchange-traded funds and physical holdings.
Beyond geopolitical considerations, currency dynamics have played an equally important role. A weakening U.S. dollar makes gold—priced globally in dollars—more affordable for foreign buyers, thereby expanding demand. Simultaneously, declining U.S. Treasury yields reduce the opportunity cost of holding a non-yielding asset like gold, making it more attractive relative to dollar-denominated bonds. Both of these macro drivers have been working in gold's favor as we move through the first quarter of 2026.
What The Analysts Are Forecasting
The analyst community has grown notably more bullish on gold as prices have climbed. JPMorgan's commodities team projects that spot gold could reach approximately $6,300 per ounce by year-end 2026, implying a further 20-25% upside from current levels. This forecast rests on expectations for sustained demand from central banks and investors, combined with anticipated further weakness in the U.S. dollar and potential cuts to interest rates later in the year. Goldman Sachs, meanwhile, has raised its year-end 2026 target to $5,400 per ounce, citing strong ETF inflows and structural demand from global investors. ING Think projects a full-year 2026 average near $5,190 with quarterly progression toward $5,450 by the fourth quarter. Across these institutional forecasts, a consistent narrative emerges: gold is poised to trade higher as the year progresses.
Key Factors That Will Determine Gold's Next Move
Several critical variables will shape gold's trajectory over the coming weeks and months. U.S. inflation data and Federal Reserve policy signals will warrant close monitoring, as interest rate expectations remain inversely correlated with gold prices. The relative strength of the U.S. dollar against major currencies will continue influencing demand, with dollar weakness generally supportive for gold. Central bank activity—both purchases and any policy shifts—could accelerate or dampen the advance. Energy prices, particularly oil, often rise alongside geopolitical tensions and can signal shifts in risk appetite. Finally, equity market volatility will influence whether investors perceive gold as sufficiently attractive relative to stocks for portfolio allocation purposes.
Practical Takeaway For Traders
The current environment offers both opportunities and risks. For bullish traders, the $5,000 support level provides a defined risk point, with upside targets initially near $5,350 and subsequently toward the $6,000-plus levels suggested by longer-term analyst forecasts. For more cautious participants, the range-bound nature of trading between $5,000 and $5,350 suggests that patience and adherence to technical levels will likely prove more rewarding than aggressive directional bets. Regardless of approach, gold's demonstrated ability to hold the $5,000 floor while simultaneously attracting buyers on any dips reinforces its status as the preferred safe-haven asset during uncertain times.