Spot gold’s latest slide is a reminder that even “safe havens” are not immune when the macro narrative shifts from fear to central-bank resolve. After testing the psychologically important $5,000 area and retreating more than 1% on the day, bullion has come under pressure as traders ramp up bets that the Federal Reserve may not only delay rate cuts, but potentially resume tightening in the face of sticky inflation and conflict-driven energy shocks.[4][6] As capital rotates back into the U.S. dollar and short-dated yields, haven demand for gold is being forced to compete with a rising carry on cash and Treasuries.[1][7]
WHAT’S DRIVING GOLD’S PULLBACK?
Several forces are converging against gold at once, and together they explain why prices have retreated so sharply from recent highs.
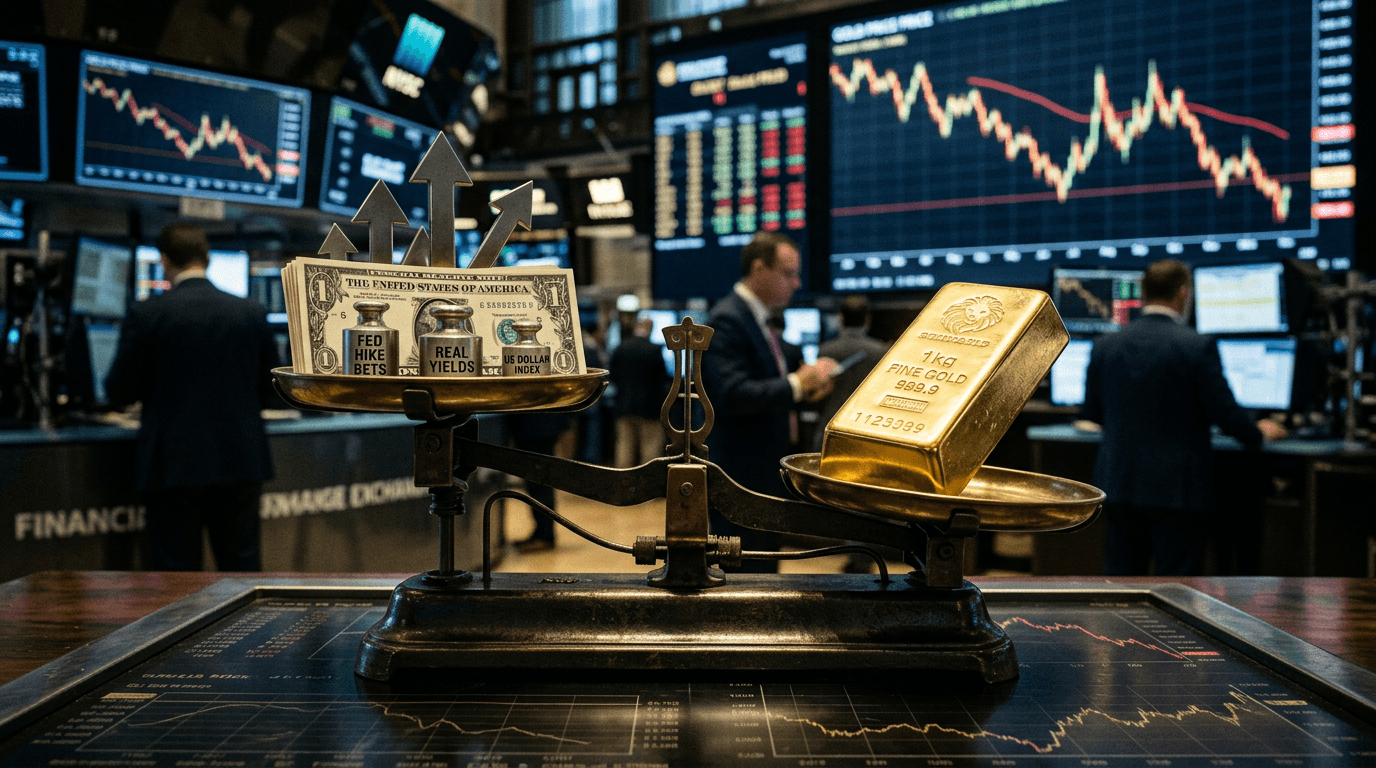
First, the dollar has strengthened as investors price in a more hawkish Federal Reserve path. Gold priced in dollars tends to weaken when the greenback rallies, because it becomes more expensive for non‑U.S. buyers and less attractive versus dollar cash.[1][6][7] Recent sessions have seen the dollar index notch multi‑day gains alongside a notable repricing of Fed expectations, with hike odds at upcoming meetings climbing from single digits to the mid‑30% range in just a week.[1]
Second, inflation anxiety is shifting from “good for gold” to “bad for rates.” Renewed hostilities and disruptions around the Strait of Hormuz and broader Middle East have pushed energy prices higher, raising the risk that inflation will remain above target for longer.[6][7] That dynamic is now being interpreted as a reason for the Fed to keep policy restrictive—or even tighten further—rather than an argument for early easing.
Third, higher real yields are directly undermining bullion. Gold is a non‑yielding asset; when policy expectations move toward higher or more persistent interest rates, the opportunity cost of holding gold rises. Traders are seeing that in the form of higher bond yields and steeper money‑market curves, which historically correlate negatively with gold.[1][4][5] That is why we can see gold sliding even as inflation risks are rising.
Safe Haven Vs Inflation Hedge: The Paradox Explained
At first glance, the move looks paradoxical: conflicts are escalating, energy prices are climbing, inflation is a clear concern—and yet gold is dropping. The key is distinguishing between gold’s roles as a long‑term inflation hedge and a short‑term crisis hedge.
In immediate stress episodes, global investors often prioritize liquidity and dollar safety over everything else. Market commentary around the recent slide highlighted “a shift towards liquidity — a preference for cash,” accompanied by a stronger dollar and rising bond yields.[6] That kind of behavior often leads to forced selling in liquid assets like gold to raise dollars, especially when portfolios are hit elsewhere.
Moreover, the market is reading conflict‑driven inflation as a problem for central banks, not an excuse for them to ease. Analysts have warned that surging energy costs from Middle East supply disruptions could “elevate inflation expectations” and “result in higher interest rates, which would bolster the dollar and exert additional downward pressure on gold.”[7] In other words, the same inflation that supports gold’s long‑term purchasing‑power story can hurt its short‑term price when it keeps central banks in tightening mode.
Finally, sentiment has flipped from “rate cuts soon” to “higher for longer.” Earlier optimism that the Fed would pivot to easing has been scaled back as officials signal they are prepared to consider further hikes if inflation does not cool.[1][7][8] As those rate‑cut bets fade, so does one of the key pillars that propelled gold to recent record highs.[2][4][5]
Key Levels And Indicators To Watch
For traders, the current environment turns gold into a macro‑sensitive instrument, tightly linked to rates, FX, and energy markets rather than just a simple fear gauge.
On the chart, the $5,000 zone has emerged as a pivotal support level. Spot prices recently retreated to test this area, sliding more than 1% on the day as the market reassessed Fed policy after an inflation and oil‑driven scare.[4] Below there, deeper pullbacks could open the door toward prior consolidation zones, while sustained closes back above recent Fibonacci retracement levels around $5,100–$5,150 would signal that dip‑buyers are regaining control.[5]
In parallel, the following macro indicators deserve constant attention:
- Fed funds futures and tools that track meeting‑by‑meeting hike odds. A further rise in implied probabilities of a hike—or a pushout of the first cut—tends to weigh on gold.[1][8]
- U.S. real yields (nominal Treasury yields minus inflation expectations). Rising real yields are historically one of the strongest headwinds for bullion.[5]
- The dollar index (DXY). A continued breakout in the dollar makes any sustained gold rally harder to maintain.[1][6][7]
- Crude oil benchmarks. Further conflict‑driven spikes could worsen the inflation‑vs‑rates trade‑off that is currently pressuring gold.[6][7]
In essence, the gold chart is now a compressed macro dashboard: moves are less about mine supply or jewelry demand, and more about the interplay of inflation, energy, and the Fed.
Practical Takeaways For Traders And Simulated Strategists
For active traders—especially those honing strategies in a simulated environment—this episode offers several concrete lessons.
First, always map the second‑order effects. Inflation headlines may sound bullish for gold, but if they push central banks toward tighter policy, the rate and FX response can overpower the simple “inflation hedge” narrative in the short run. Building a playbook that explicitly links “data surprise → Fed pricing → dollar/yields → gold” can help structure trades rather than reacting to single headlines.
Second, respect key event risks. Gold has been highly sensitive to Fed meetings, major inflation prints, and labor data that shape policy expectations.[1][5][8] In practice, that means adjusting position size and leverage ahead of these catalysts, or even stepping aside if your edge comes from trending markets rather than binary outcomes.
Third, focus on correlation risk. When tensions spike, correlations across macro assets can tighten: gold, oil, equities, and rates can all move in powerful, correlated swings. A simulated account is the ideal place to test how your strategy behaves when several positions lean on the same macro theme—without realizing it.
Finally, treat levels like $5,000 not as magic, but as liquidity magnets. Psychological round numbers attract option strikes, stop orders, and large resting bids/offers.[4] Backtesting entries and exits around such levels—rather than on them—can yield more realistic execution assumptions.
The Big Picture: Short-term Pain, Long-term Role
Gold’s retreat on renewed Fed hike bets does not invalidate its strategic role; it simply underlines that timing matters. In the short term, as long as the narrative centers on “higher for longer” rates, gold will have to fight a headwind from real yields and a firm dollar.[1][4][7] That can produce sharp, sentiment‑driven drawdowns like the current one.
Over longer horizons, however, the very forces now unsettling markets—persistent inflation risk, geopolitical fragmentation, and elevated debt loads—are the same ones that historically support gold as a diversifier and store of value.[2][4][6] For traders and investors alike, the challenge is to separate those horizons: respect the macro‑rate cycle in your trading, while recognizing that pullbacks driven by hawkish repricing may create better entry points for long‑term exposure.
In other words, gold sliding on inflation worries and renewed Fed hike bets is not a contradiction—it is the market reminding you that every hedge has a price, and that price is set, day by day, in the cross‑currents of policy, conflict, and liquidity.