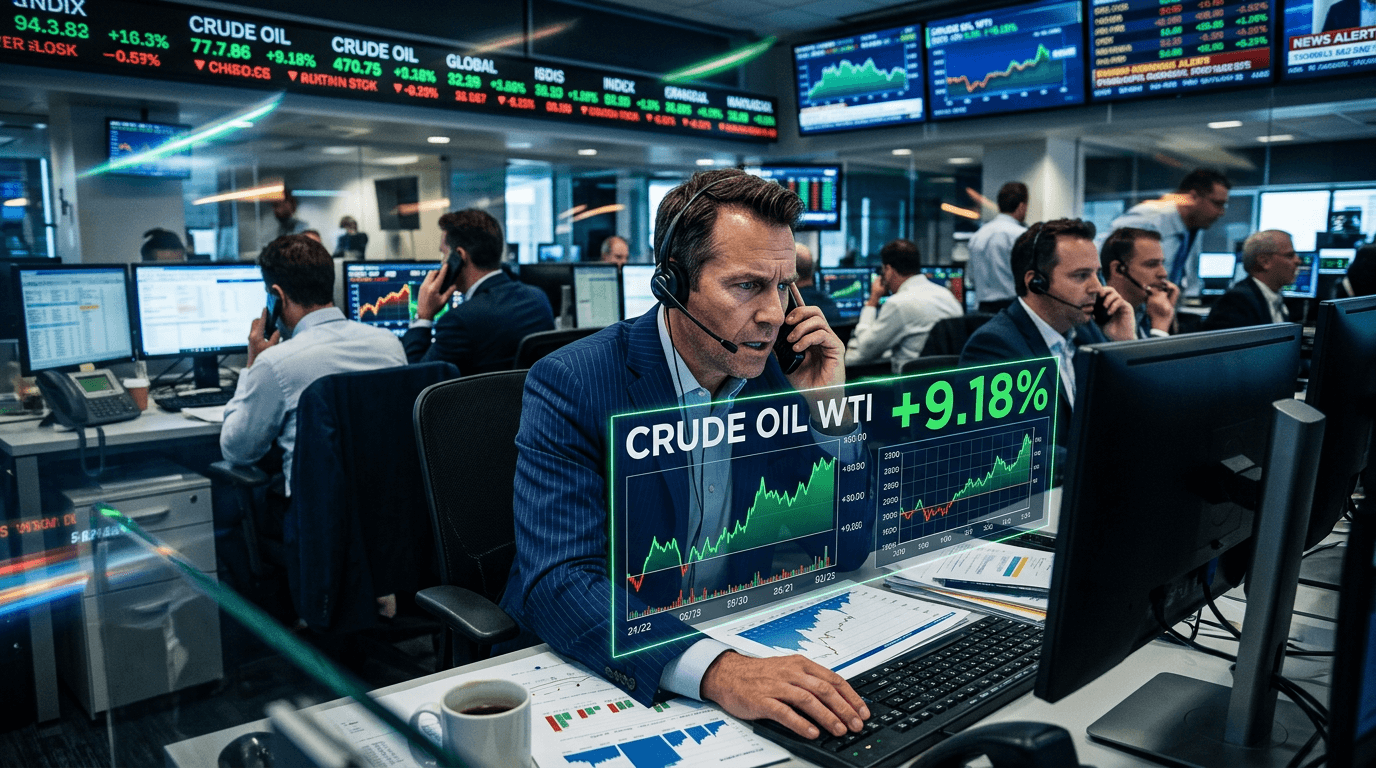
Oil’s latest surge is a stark reminder of how quickly geopolitics can reset the market narrative. A sudden escalation of conflict involving Iran sent crude prices almost 9% higher in a single session, with U.S. benchmark futures jumping to the low $80s and Brent pushing toward the mid‑$80s.[1][4] This is not just an “oil story” – it’s a cross‑asset shock that is reshaping risk sentiment, volatility, and trading opportunities across global markets.
WHAT TRIGGERED THE 9% OIL SPIKE?
The immediate catalyst was an escalation in hostilities with Iran, including attacks that disrupted shipping lanes near the Strait of Hormuz – a critical chokepoint for global oil flows.[1] Nearly a fifth of the world’s crude passes through this narrow waterway, so any threat to navigation there can quickly translate into supply fears and price spikes.[1][4]
In response, crude futures saw an aggressive repricing. Benchmarks that had been trading comfortably below recent highs suddenly vaulted higher, with intraday moves reminiscent of the early phases of the Russia‑Ukraine war when oil futures surged into triple digits before later retracing.[2][3] While prices in this episode peaked below the extremes seen in 2022, the percentage move – roughly 9% in a day – is large by historical standards and signals a regime shift in perceived geopolitical risk.
It is also notable that European officials have tried to play down immediate supply fears, with the European Commission indicating that it does not yet see a direct threat to short‑term oil availability.[1] That highlights an important distinction traders must make: prices often move on expectations of disruption, well before any actual barrels are removed from the market.
Why Iran Matters So Much For Energy Markets
Iran is not just another oil producer. It sits at the heart of the Gulf, borders the Strait of Hormuz, and has a history of tensions with key shipping and energy‑producing states. Any conflict there sends a signal that the security premium embedded in oil prices needs to be higher.[1][4]
There are three main risk channels markets focus on
1) Direct production risk Conflict can impede Iran’s own output and exports, especially if infrastructure, ports, or loading facilities come under threat. Similar concerns surfaced when war headlines first pushed crude toward $115 per barrel in prior flare‑ups, before markets reassessed the actual level of disruption.[2][3]
2) Transit and shipping risk The bigger concern is often transit risk. Attacks on tankers, naval confrontations, or mining of key waterways can raise insurance costs, slow traffic, or even temporarily halt shipments, as seen in recent disruptions around the Strait of Hormuz.[1] Even a short‑lived disruption can distort physical flows and prompt aggressive hedging in futures markets.
3) Secondary sanctions and escalation risk Geopolitical shocks rarely stay neatly contained. Traders must consider the risk that sanctions tighten, that other regional producers are dragged into the conflict, or that shipping companies become more cautious, amplifying logistical bottlenecks. These second‑order risks are harder to quantify, which is exactly why volatility jumps when conflict headlines hit the tape.[4]
How The Oil Shock Is Hitting Broader Markets
The 9% spike in oil is part of a broader risk‑off move across assets. Higher energy prices are effectively a tax on consumers and businesses, reviving concerns about inflation and growth just as many economies are trying to normalize after previous shocks.
Equity markets have responded with higher volatility and sharp intraday swings. During earlier phases of the Iran conflict, U.S. stocks opened sharply lower before clawing back losses as investors reassessed the likely duration and impact of the war.[3] That pattern underscores how fast sentiment can shift: the first reaction is often to de‑risk, then selectively re‑enter as more information emerges.
Safe‑haven demand has also picked up. Historically, episodes of Middle East tension accompanied by oil spikes have seen flows into the U.S. dollar and gold, as investors look for assets perceived as stores of value or funding currencies. Commodity‑linked and higher‑beta currencies – such as those of smaller, export‑dependent economies – tend to underperform when risk appetite falters, even if some energy exporters gain a partial offset from higher oil revenues.
Within commodities, the shock is not limited to crude. Refined products such as gasoline and diesel often move in tandem, affecting inflation expectations and the outlook for central bank policy. Volatility also tends to rise along the entire energy complex, from natural gas to related equities, as traders reposition portfolios around a higher and more uncertain oil price path.
What This Means For Traders And Simulated Strategies
For active traders, a 9% daily move in a core macro asset like oil is both a risk and an opportunity. The key is having a framework to interpret the shock and to avoid being whipsawed by headline‑driven noise.
Here are several practical angles to consider in a simulated trading environment:
1) Volatility and position sizing When realized and implied volatility spike, traditional position sizes may suddenly carry much larger risk. Simulated trading allows you to stress‑test how a given futures or CFD position behaves when oil gaps 5–10% overnight, and how stop‑losses or hedges might perform in those scenarios.
2) Cross‑asset correlations Geopolitical oil shocks often strengthen correlations between crude and other assets: energy equities, high‑yield credit, certain emerging‑market currencies, and even inflation‑sensitive sectors. Testing pair trades – such as long oil / short airline stocks, or long energy sector ETFs against broader indices – in a SimFi environment can help you understand how these relationships behave under stress.
3) Term structure and curve trades Large front‑month moves can reshape the futures curve, for example by pushing the market deeper into backwardation (near‑dated contracts more expensive than longer‑dated) as traders price immediate risk over long‑term supply. Simulated strategies that compare different maturities, like calendar spreads, can help you explore whether the market is overpricing short‑term fear relative to long‑term fundamentals.
4) Scenario analysis and news sensitivity Because conflict headlines can change rapidly – as seen when oil has spiked toward $120 before retreating back toward $90 once fears eased in past episodes[2][3] – it is vital to practice scenario analysis. How would your portfolio react if tensions escalate and oil makes another 10–15% leg higher? What if a ceasefire or diplomatic breakthrough triggers a sharp pullback? Simulated trading lets you rehearse these “what if” paths without capital at risk.
Key Takeaways For Navigating Geopolitical Oil Shocks
The latest 9% surge in oil prices is a textbook example of how geopolitical risk premium can reprice suddenly when a key producer and transit hub like Iran is involved.[1][4] For traders and investors, several lessons stand out:
First, understand the transmission channels. Oil does not move in isolation: it affects inflation expectations, central bank policy narratives, corporate margins, and ultimately equity valuations.
Second, respect volatility. In an environment where a single headline can swing crude by several dollars, risk management and position sizing are as important as directional calls.
Third, think beyond the first move. Initial spikes driven by fear and uncertainty can be followed by sharp reversals as the market reassesses actual supply disruptions, as seen when earlier war‑related surges above $100 per barrel later faded back below those peaks.[2][3]
Finally, use simulated environments to build and test playbooks before committing capital. Geopolitical shocks will keep recurring, but the traders who have rehearsed their responses – across oil, equities, FX, and rates – are better positioned to navigate the turbulence and turn market stress into structured opportunity.