
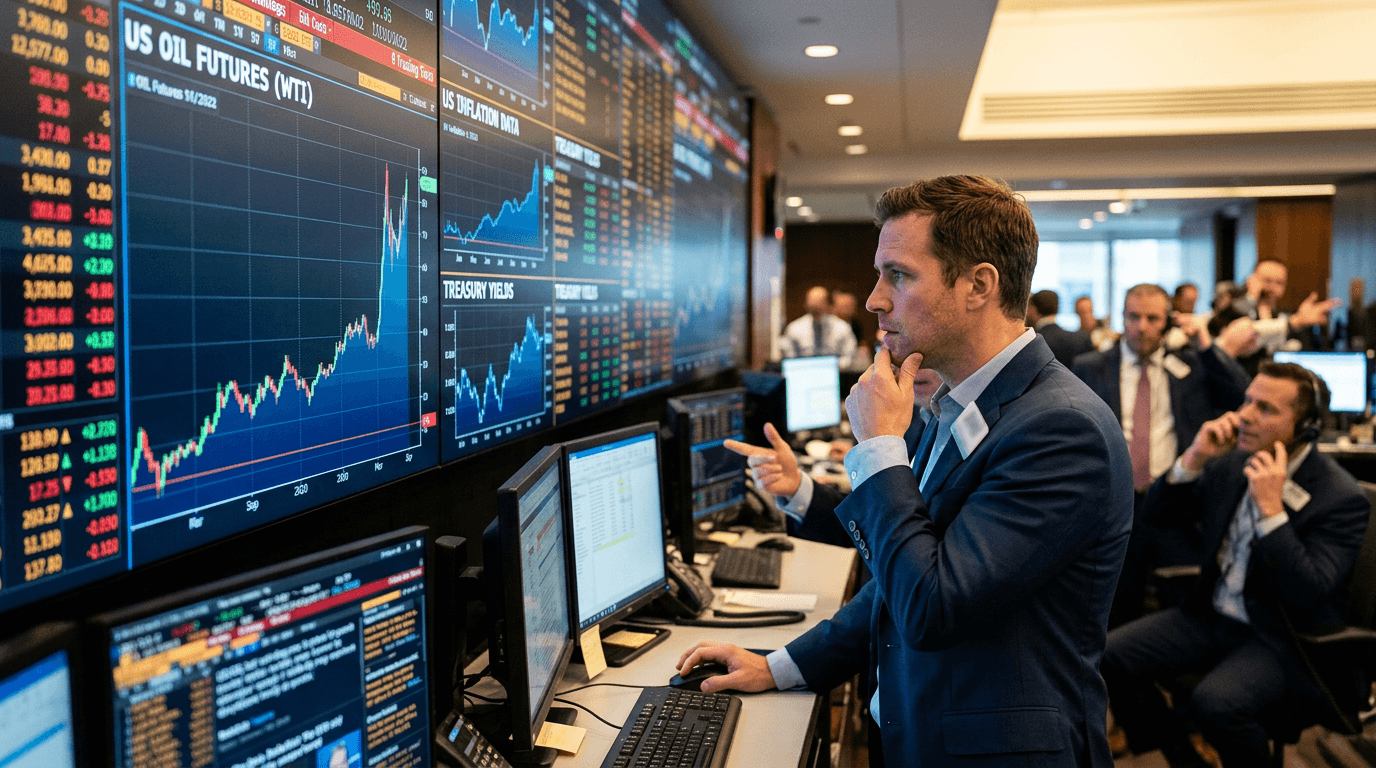
US oil futures jolted higher by more than 9% after renewed strikes between the US and Iran, sending crude to fresh multi‑month highs and rippling across every major asset class.[1][3][7] The sudden spike revived inflation fears, steepened global yield curves, and knocked both US and Asian equity indices lower as traders rapidly repriced the odds of a “higher for longer” interest rate environment.[3][5] For active traders, this is not just a headline — it is a live case study in how geopolitics, commodities, bonds, and equities interact in real time.
GLOBAL MARKETS ROCKED BY A 9% OIL SPIKE
Oil is the world’s most important traded commodity, so a near double‑digit daily move is never a local story.[3] US crude and Brent futures jumped roughly 9%, with Brent pushing into the high‑$70s and briefly trading above $80 as tanker traffic through the Strait of Hormuz was disrupted.[1][3][7] Moves of this magnitude are typically reserved for major supply shocks or crisis scenarios, and that is exactly what markets are now trying to price.
The conflict has raised the risk of sustained disruption to oil flows from one of the most strategically important regions on the planet.[1][3][5] Even before a full closure of the Strait, “selective” attacks and heightened security fears pushed shipping and insurance costs higher and led many tankers to halt transit altogether.[3][7] History shows that when oil logistics are in doubt, prices tend to move first and fundamentals get sorted out later.
Equity markets reacted in textbook fashion for an energy‑driven shock. US indices opened sharply lower, and Asian markets followed as traders marked down sectors most exposed to higher energy and financing costs.[3][5] Even where intraday losses were pared, the message from price action was clear: the volatility regime just changed.
Why Conflict In Iran Hits Oil So Hard
To understand why this conflict moves markets so aggressively, you need to understand the geography. The Strait of Hormuz is the key chokepoint for Middle Eastern oil and LNG exports; prior episodes of disruption there have triggered some of the largest supply shocks on record.[1][5] During the 2026 Iran war, the International Energy Agency called the associated shutdown and shipping freeze “the largest supply disruption in the history of the global oil market.”[5]
When traders see drone strikes, tanker attacks, or military escalation in this corridor, they immediately reassess:
– How much supply could be lost, and for how long? – How quickly can spare capacity elsewhere be brought online? – How will governments respond with strategic reserves?
In the current flare‑up, the concern is not only physical supply but also the risk that the conflict broadens to involve more producers or infrastructure.[3][5] Analysts have repeatedly warned that if disruptions are prolonged, Brent could surge into triple digits, echoing the 1970s‑style energy shock dynamics of elevated inflation and weaker growth.[1][3][5]
From Oil Shock To Inflation And Rates
A 9% jump in oil is not just about fuel costs; it is an inflation story.[3][5] Higher crude prices feed directly into gasoline and diesel, but also indirectly into transport, manufacturing, airlines, agriculture, and ultimately consumer prices. In earlier phases of the current conflict episode, US gasoline prices were already pushed higher as crude rallied, eroding household purchasing power and consumer confidence.[5]
Bond markets are quick to connect these dots. If inflation proves stickier because of a sustained energy shock, central banks have less room to cut rates — and may even need to tighten further.[5] During the broader Iran war period, rate‑cut expectations were repeatedly pushed back as inflation forecasts were revised higher and policymakers emphasized the need to stay restrictive for longer.[5]
This repricing shows up in the yield curve. Longer‑dated yields can rise faster than short‑term rates as investors demand additional compensation for inflation and geopolitical risk, steepening the curve.[5] That is precisely what global markets have started to reflect: higher term premiums, higher real yields, and waning hopes for rapid policy easing.
For risk assets, the combination is uncomfortable: higher energy costs, higher funding costs, and a higher discount rate applied to future earnings. That is why, historically, large oil spikes associated with conflict have coincided with periods of weaker equity performance and higher cross‑asset volatility.
What This Means For Risk Assets And Portfolios
For equity traders, the impact of a sudden oil shock is highly sector‑specific. Energy producers and certain commodity‑linked names can benefit from higher prices, while airlines, shipping, consumer discretionary, and rate‑sensitive growth stocks often come under pressure as margins get squeezed and discount rates rise.
Credit markets may also reprice quickly. Companies with heavy energy exposure or fragile balance sheets can see spreads widen as investors reassess default risk in a higher‑inflation, higher‑rate scenario. Meanwhile, safe‑haven flows may support the US dollar and selected government bonds, even as yields rise in other parts of the curve.[3][5]
For macro and multi‑asset traders, the key question is whether this proves to be:
– A short‑lived geopolitical flare‑up that fades as quickly as it arrived, or – The start of a more persistent regime shift in inflation, policy, and risk premia.
Positioning around that uncertainty is where both opportunity and risk lie. Correlations can change quickly; for example, stocks and bonds may fall together if inflation and term premiums are the dominant drivers, rather than growth concerns.
SIMULATED TRADING: STRESS‑TESTING YOUR STRATEGY IN REAL TIME
For traders using simulated finance (SimFi) platforms, episodes like this are invaluable live drills. They compress a lot of market structure lessons into a short window:
– How do oil futures behave around geopolitical headlines and gaps? – How do equity indices, bond yields, and FX respond relative to crude? – How quickly do volatility and liquidity conditions change?
Because simulated environments mirror real‑world prices without putting real capital at risk, they allow traders to practice executing during fast markets, refine risk limits, and test hedging ideas across asset classes. For example, a trader might experiment with:
– Hedging an equity index position with energy stocks or crude futures – Using options to manage gap risk around key geopolitical or policy announcements – Adjusting position sizing when volatility spikes and bid‑ask spreads widen
Equally important is the psychological component. Sudden 9% moves in a core asset like oil can trigger fear of missing out, panic‑selling, or over‑trading. A simulated environment gives traders room to observe their own reactions, build rules for entries and exits, and create checklists for handling news‑driven markets — all before committing to live capital.
Practical Takeaways For Traders
Several concrete lessons stand out from this latest oil spike:
First, always map macro linkages. A move in crude is not isolated; it can cascade into inflation expectations, rate paths, yield curves, and ultimately equity valuations.[3][5]
Second, respect liquidity and gap risk. News‑driven sessions often feature sharp moves on thinner order books, wider spreads, and slippage. Position sizes that feel comfortable in calm markets may be too large when volatility explodes.
Third, scenario planning matters. Traders who had already considered “oil up 10% on conflict escalation” scenarios — and planned hedges, stop‑losses, and sector rotations — were better positioned to act with discipline rather than emotion.
Finally, use simulated trading to turn events into experience. Treat this oil shock as a case study: replay the price action, test how your strategy would have performed, and refine your playbook for the next time geopolitics collides with markets.