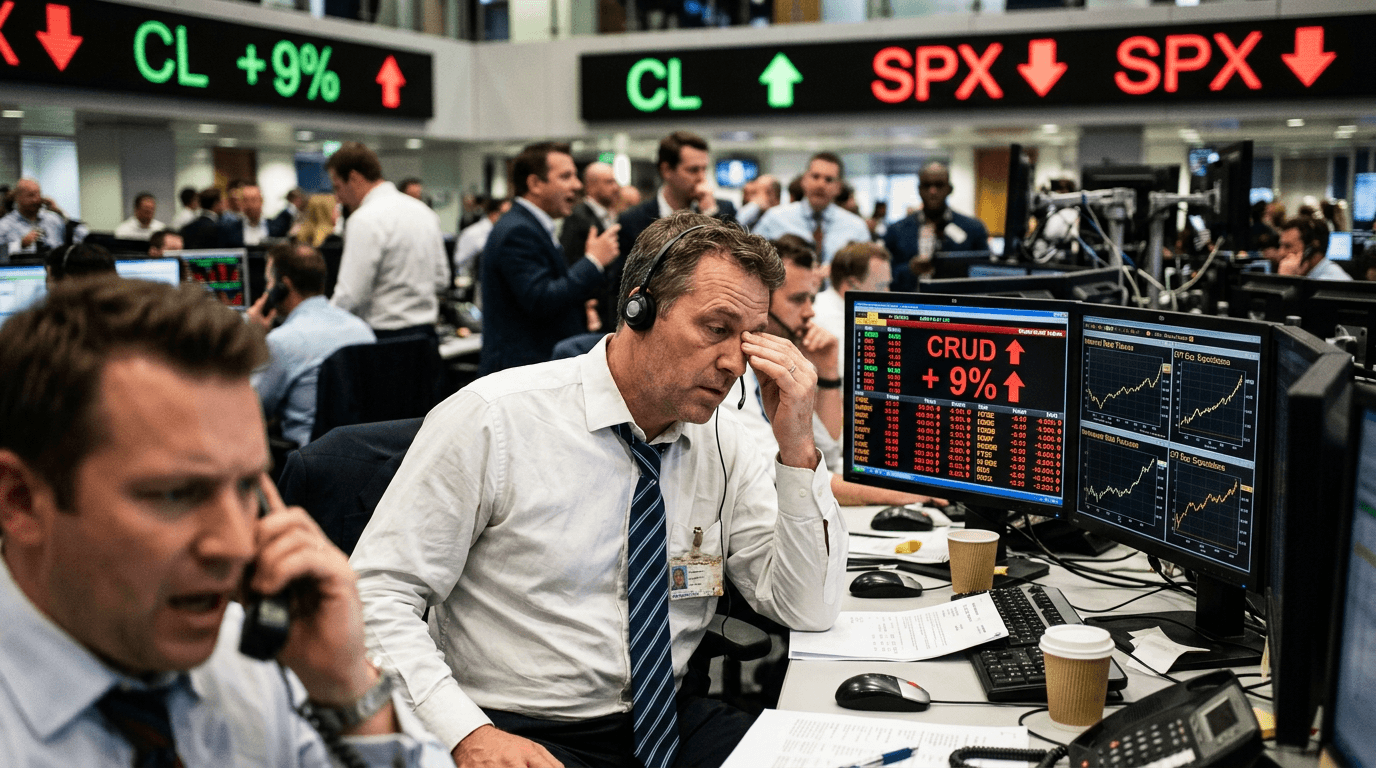
Oil’s latest surge has reminded markets how quickly geopolitics can rewrite the macro narrative. Crude futures jumped as much as 9% intraday on fresh military clashes between the US and Iran, briefly pushing WTI above recent range highs and Brent toward the mid‑$80s. That move was enough to rattle global equities, revive inflation fears, and force traders to reassess how much easing they expect from the Federal Reserve later this year.
WHAT’S DRIVING THE OIL SPIKE?
The immediate catalyst is an escalation in US‑Iran tensions, with renewed clashes raising the perceived risk of disruption to Middle East oil flows. Even when no barrels are physically taken off the market, traders tend to re‑price the “risk premium” embedded in crude, especially when shipping routes or strategic infrastructure could be at stake.
The market’s reaction reflects three overlapping concerns:
1) Supply risk: Any threat to production facilities, export terminals, or critical chokepoints like the Strait of Hormuz can tighten supply expectations. Historically, even temporary disruptions or the fear of them have produced sharp, if sometimes short‑lived, price spikes.
2) Inventory psychology: When geopolitical risk rises, refiners and traders may prefer to hold more inventory as a buffer. That hoarding impulse can intensify spot demand and steepen backwardation (near‑month prices rising faster than longer‑dated contracts).
3) Positioning and leverage: Crude markets are heavily influenced by futures and options flows. A headline‑driven spike can trigger stop‑losses on short positions and force covering, amplifying the move beyond what fundamentals alone might justify.
For now, the move remains a risk‑premium shock rather than a confirmed structural supply loss. But markets are clearly pricing a higher probability of tighter conditions ahead.
Why Equities React When Oil Jumps
A 9% intraday move in oil is not just an energy story; it’s a macro shock. The drag on global equities comes through several channels.
First, higher energy costs act like a tax on consumers and non‑energy businesses. For households, more of each paycheck goes to fuel and utilities, leaving less for discretionary spending. For companies, higher input and transportation costs can compress margins unless they can pass prices through.
Second, sector leadership shifts. Energy producers, oil‑field services, and some commodity‑linked names may benefit from higher prices and widening refining margins. But energy‑intensive sectors such as airlines, logistics, chemicals, autos, and parts of manufacturing often come under pressure. Broad indices can fall even as the energy sector rallies strongly.
Third, risk sentiment deteriorates when geopolitical risk rises. Investors demand a higher risk premium on equities, especially in cyclical and small‑cap segments. Higher volatility can lead to de‑risking by systematic and risk‑parity strategies, which tend to reduce equity exposure as volatility spikes.
For traders, this means that index moves may mask powerful rotations below the surface. While headline indices struggle, relative strength can emerge in energy, defense, and select commodities, while growth and rate‑sensitive names wobble on the prospect of stickier inflation.
Inflation, Breakevens, And The Fed
The most important macro shift from this oil spike is in inflation expectations and rate‑cut odds, not just in the spot price of crude.
Market‑based inflation expectations, such as breakeven rates derived from TIPS (inflation‑protected Treasuries), moved higher as energy prices spiked. Higher expected gasoline and heating costs feed into headline inflation, even if core measures (excluding food and energy) are less volatile.
This matters because the Fed targets inflation, and markets price the policy path through instruments like fed funds futures and OIS (overnight index swaps). As traders saw higher near‑term inflation risks, they pared back aggressive expectations for Fed easing later in the year. Fewer cuts, or cuts pushed further out, imply higher real yields than many equity valuations currently assume.
In practice, the chain looks like this:
Oil shock → higher expected headline inflation → rising breakevens → markets question how quickly the Fed can cut → rate‑sensitive assets (growth equities, long‑duration bonds, real estate) re‑price
If the oil spike proves short‑lived, some of this repricing may unwind. But if geopolitical tensions persist and oil holds at elevated levels, central banks could face an uncomfortable trade‑off between supporting growth and fighting another inflation flare‑up.
Key Metrics Traders Should Watch
In a fluid geopolitical situation, price action often moves faster than official data. Short‑term traders and investors alike can benefit from tracking a few key indicators:
1) Crude benchmarks and spreads - WTI and Brent front‑month futures levels - Brent–WTI spread, which can reflect regional supply constraints and geopolitical risk - Time spreads (near‑term vs. longer‑dated contracts) to gauge whether the market is tightening (backwardation).
2) Inflation expectations and rates - US 5‑year and 10‑year breakeven inflation rates - Real yields on TIPS - Fed funds futures implied cuts for upcoming FOMC meetings.
3) Equity market internals - Sector performance: energy vs. consumer discretionary, industrials, and transports - The VIX (equity volatility index) for risk sentiment - Relative performance of small caps vs. large caps, which are typically more sensitive to growth and cost shocks.
4) Safe‑haven flows - US dollar index (DXY) - Gold prices - US Treasuries and the MOVE index (bond volatility).
Together, these indicators provide a real‑time map of how the shock is propagating across asset classes.
Tactical Ideas For Simulated Traders
Simulated finance environments are particularly useful when markets are driven by geopolitical headlines, because traders can practice navigating fast, uncertain conditions without real‑world capital at risk.
Here are a few ways to use this environment constructively:
1) Test cross‑asset scenarios Build trade ideas that link crude to equities and rates—for example, long energy equities vs. short broad indices, or trades that benefit if breakevens rise faster than nominal yields. Practice sizing and hedging so that a sudden reversal in oil doesn’t wipe out the entire strategy.
2) Stress‑test risk management Use the recent 9% intraday move to calibrate stop‑loss levels and position sizing. Ask: if crude gaps another 5–10% on an overnight headline, what happens to my margin, drawdown, and portfolio VaR? SimFi platforms let you run through these “what if” scenarios repeatedly.
3) Practice trading the news cycle Geopolitical stories evolve in stages: initial shock, official responses, rumors of de‑escalation, and eventual normalization—or further escalation. Simulate trading across these phases. How do you adapt from short‑horizon, headline‑driven scalps to more medium‑term macro themes?
4) Refine your macro framework Use this episode to document your playbook: what you watch, how you interpret moves in breakevens and real yields, how you expect sectors to rotate. Over time, you can compare your framework to what actually happened, tightening the link between macro reasoning and trade execution.
Conclusion
The latest spike in oil on rising US‑Iran tensions is more than a commodity headline; it is a live stress test for global markets. Higher crude prices are pressuring equities, reshaping sector leadership, and nudging inflation expectations and Fed policy pricing in ways that matter for every asset class.
Whether this proves to be a short‑lived risk premium shock or the start of a more persistent energy and inflation story will depend on geopolitics as much as economics. In the meantime, traders who understand the cross‑asset linkages—and who systematically practice their response in a simulated environment—will be better positioned to navigate both the volatility and the opportunity that follow.