Oil markets were caught off guard as OPEC+ opted to boost production even as crude prices drifted lower, sending a jolt through the futures curve and forcing traders to reassess how supply, demand, and inflation risks fit together.[2] Instead of defending prices with deeper cuts, the cartel is accelerating its rollback of earlier reductions, adding hundreds of thousands of barrels per day back into a market that is already showing signs of softer demand.[2][6]
WHAT OPEC+ JUST DID
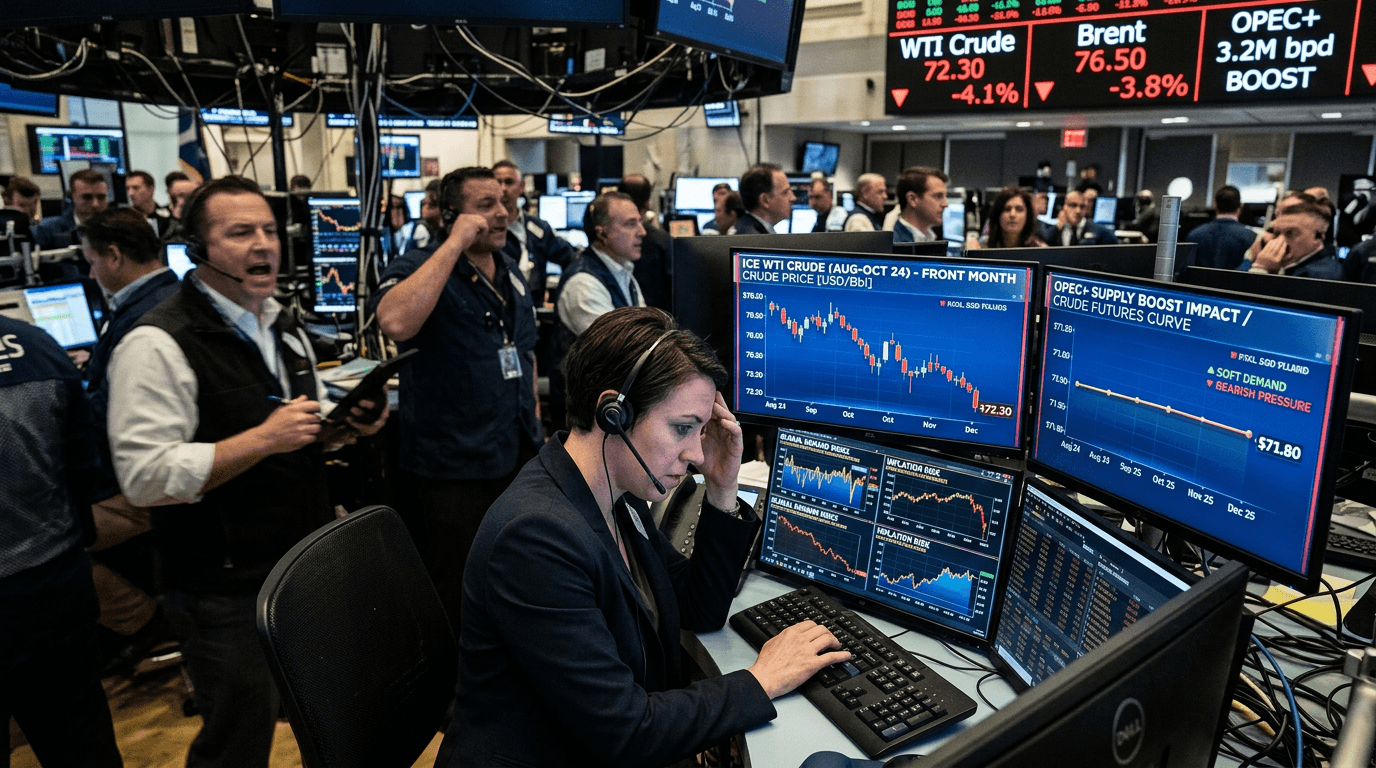
In its latest meeting, OPEC+ agreed to another increase in output quotas, continuing a pattern of incremental hikes that began with the unwinding of roughly 2.2 million barrels per day of earlier cuts.[2][6] Recent decisions have seen production targets rise by about 411,000 barrels per day in June, following similar increases in April and May, with additional boosts agreed for subsequent months.[2][6] In parallel, a smaller group of seven producers has approved more modest quota increases of around 188,000 barrels per day for specific months, with Saudi Arabia and Russia shouldering the largest shares of those hikes.[1][4][9]
This strategy represents a clear shift from the post‑pandemic period, when OPEC+ used coordinated supply restraint to keep prices closer to the $70 per barrel range.[2][6] By restoring barrels to the market even as prices weaken, the group is signaling a willingness to tolerate lower levels—potentially as low as $60 Brent in some forecasts, with WTI expected to trade below that in the coming years.[2] For traders, the key takeaway is that OPEC+ is now leaning more toward regaining market share and normalizing supply than aggressively defending specific price thresholds.
Why Prices Fell While Output Rose
The immediate market reaction has been lower front‑month prices and increased pressure on near‑dated futures.[2] When a major supplier announces more barrels into a backdrop of softening demand—slower growth, weaker industrial activity, and reduced refinery runs—prices adjust to reflect the risk of oversupply.[2][7] In recent trading, Brent and WTI futures dropped more than 3% following the announcement, underscoring how sensitive the market is to perceived supply‑demand imbalances.[2]
This dynamic is especially challenging for higher‑cost producers, such as some U.S. shale operators whose break‑even prices can sit near or above the new projected ranges.[2] While U.S. companies have boosted efficiency and can produce more with fewer wells and rigs, persistent price pressure raises questions about future investment and output growth.[2] For macro‑focused traders, this is a classic example of how a policy decision by a producer group can ripple across corporate earnings, credit risk, and equity valuations in the energy sector.
How The Crude Futures Curve Is Reacting
The headline impact is not just on spot prices, but on the shape of the crude futures curve. With front‑month contracts selling off more than some of the longer‑dated tenors, parts of the curve have flattened as traders mark down near‑term scarcity premiums.[2] In simple terms, the market is pricing less tightness in the next few months, as fresh supply meets tepid demand and inventories are expected to rebuild.
This move matters because the curve’s shape—backwardation versus contango—affects everything from storage economics to roll yields for futures‑based strategies. A flatter curve reduces the benefit of holding long positions in nearby contracts when the market is in backwardation, and it can change the cost of hedging for producers and consumers. For traders operating on SimFi platforms like E8 Markets, curve shifts create opportunities to test strategies that exploit term‑structure changes: spread trades between near‑dated and deferred contracts, calendar spreads, or relative value positions across different benchmarks.
Key practical implications of the curve adjustment include:
Near‑term volatility: Front‑month contracts can remain more volatile as the market digests new supply data and inventory reports, so risk management around roll dates becomes crucial.
Hedging behavior: Producers may extend hedges further out the curve if longer‑dated prices hold up relatively better than spot, while consumers might take advantage of lower prompt prices to lock in fuel costs.
Options pricing: Implied volatility and skew can shift as traders reassess downside risks in the near term versus longer‑term price floors, opening opportunities in structure trades like calendars and butterflies.
Macro And Inflation Implications
Beyond the commodity market, the OPEC+ decision has direct macro and inflation implications. Lower or capped crude prices feed into gasoline, diesel, and jet fuel costs, which are major components of headline consumer price indices in many economies.[2][8] If energy prices stabilize at lower levels, central banks may see some relief on headline inflation, even if underlying core measures (excluding food and energy) remain sticky.
However, the signal is mixed. On one hand, cheaper energy can ease cost pressures for households and businesses, supporting real incomes and potentially giving central banks more room to hold or cut rates. On the other, the fact that OPEC+ is boosting output into a softening demand environment may itself reflect a weaker global growth backdrop—slower China imports, cautious industrial activity, and cautious refinery purchasing.[2][7] Traders need to interpret whether falling prices are a positive “supply shock” or a negative “demand signal.”
For macro traders, three lenses are useful:
Inflation trajectory: How quickly do lower fuel prices pass through to CPI prints, and are central banks likely to emphasize these moves in their communications?
Growth expectations: Are weaker energy prices coinciding with downgrades to global GDP forecasts, or do they primarily reflect policy choices by producers?
Policy reaction: Does cheaper oil increase the probability of rate cuts, or do central banks remain focused on core inflation and wage dynamics?
What Traders Can Do Now
For active traders and simulated traders alike, the OPEC+ announcement is a prompt to revisit assumptions about both the oil complex and broader macro trades. Several practical steps stand out:
Re‑map the curve: Examine how spreads between front‑month and later‑dated contracts have moved and consider whether the new term structure aligns with your supply‑demand view.
Stress‑test scenarios: Use simulation to model outcomes where OPEC+ continues to add barrels, pauses, or reverses course, and evaluate how each scenario would affect prices, volatility, and correlations with equities and FX.
Watch cross‑asset signals: Track energy‑linked equities, credit spreads in high‑yield energy names, and inflation‑linked instruments to see how other markets are digesting the news.
Refine risk management: In a flatter curve environment, pay close attention to roll mechanics, margin requirements, and position sizing, especially around key OPEC+ meetings and inventory data releases.
In the SimFi context, events like this are ideal case studies: a clear policy shock from a major producer group, rapid price adjustment, and visible curve reshaping. By experimenting with different strategies in a risk‑free environment, traders can build intuition about how oil decisions intersect with macro trends, inflation risks, and central bank policy paths—skills that translate directly to real‑world markets.