
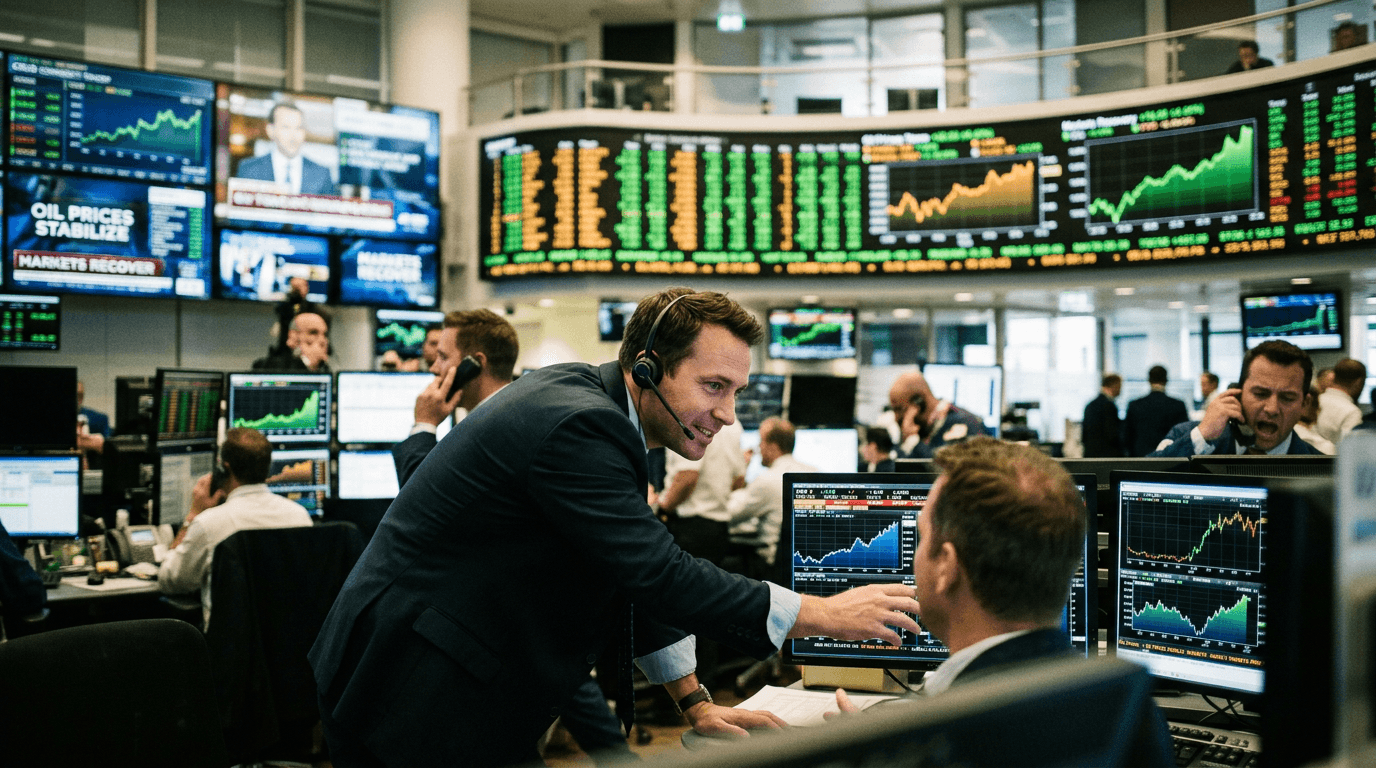
Global markets have staged a notable recovery after an Iran‑driven risk sell‑off, as softer political rhetoric has reopened the door to negotiation and crude oil prices have slipped back from recent highs[5]. Equities, high‑beta currencies and select emerging‑market FX have retraced part of their losses, while demand for classic safe havens like gold, the dollar and long‑dated government bonds has cooled[5]. For traders, this is a textbook example of how quickly sentiment can turn when geopolitical risk moves from “escalation” to “manageability.”
Markets Snap Back: A Classic Geopolitical Pattern
History shows that markets often follow a familiar pattern during major conflicts: a sharp drawdown as worst‑case scenarios are priced in, followed by a rapid rebound when the probability of extreme outcomes appears to fall[1]. That sequence has played out again around the Iran conflict, with indices hitting multi‑month lows before snapping back on hopes of de‑escalation[1].
Statements from key political actors hinting at dialogue or limits to further escalation have helped investors reassess the risk of prolonged disruption to energy supplies[9]. As markets reprice from “open‑ended conflict” toward “contained risk,” equity benchmarks have bounced and volatility indicators have eased, reflecting a shift from fear to cautious optimism[8].
For simulated and live traders alike, this pattern underscores an important lesson: market reactions to geopolitics are often front‑loaded. Prices move dramatically on fears and speculation, then mean‑revert as information improves and extreme scenarios are ruled out.
Why Crude Stabilization Matters So Much
Oil sits at the center of the market’s reaction function to Middle East conflict. Initial reports of strikes, potential disruption in the Strait of Hormuz and large‑scale damage to Iranian export capacity pushed crude sharply higher as traders priced in the largest energy supply shock in modern history[3][7]. With Brent moving toward recent highs, inflation expectations and risk premia surged[3][7].
A more moderate path is now taking shape. As rhetoric has softened and the probability of a severe, sustained disruption has been marked down, crude prices have slipped back from their peak, aligning more closely with scenarios where exports are partially disrupted but not cut off[3]. In such a scenario, research suggests oil might overshoot toward $80 before easing, with inflation effects remaining manageable and equities eventually rebounding[3].
This matters because
- Lower crude reduces the immediate inflation shock, easing pressure on central banks to stay hawkish for longer[7][9].
- Reduced energy stress supports corporate margins in transport, manufacturing and consumer sectors.
- A smaller “geopolitical premium” on oil can lower volatility across commodities and FX, improving risk‑reward for carry and trend strategies.
When traders see crude stabilizing after a spike, it often signals that the market is transitioning from pricing systemic risk to managing cyclical and sector‑specific implications.
Risk Assets Vs Safe Havens: How Flows Are Rotating
During the peak Iran scare, investors rushed into traditional safe havens—short‑dated government bonds, the US dollar, and gold—while selling equities and risk‑sensitive currencies[2][9]. Energy and defense stocks outperformed as direct beneficiaries of conflict risk, while broad indices lagged[3].
As the tone has shifted
- Equities have rebounded, with cyclical sectors and high‑beta names recovering some of their underperformance[5][8].
- High‑beta FX (such as AUD, NZD, NOK and risk‑sensitive EM currencies) have retraced losses as carry and growth narratives reassert themselves[5].
- Safe‑haven demand has moderated: gold and long‑duration bonds have given back part of their crisis‑driven gains, and the dollar’s surge has cooled[2][5].
This rotation illustrates that geopolitical shocks are not just “risk on vs risk off,” but also involve sector and factor rebalancing. Energy and defense may hold onto some of their outperformance because the conflict risk premium doesn’t disappear overnight[3][9]. At the same time, broader equity leadership is starting to re‑diversify, supported by resilient earnings, solid employment and ongoing investment in AI, electrification and infrastructure[3].
For traders, watching cross‑asset flows—equities, FX, rates and commodities together—provides a more complete picture of how sentiment is evolving than any single index.
What Traders Are Watching Next
Even as markets recover, the Iran conflict remains a live risk. Large asset managers and bank research desks emphasize several key watchpoints:
- Duration and intensity of the conflict: Markets have pivoted from expecting a quick resolution to pricing a conflict that could last months, which affects how persistent the energy shock may be[4][7].
- Strait of Hormuz risk: Any credible threat to shipping through this critical chokepoint would quickly re‑price oil and reignite inflation concerns[3][7][9].
- Policy responses: OPEC+ supply decisions, fiscal support measures in energy‑importing economies, and central banks’ reaction to renewed inflation pressure are all crucial[3][7][9].
- Growth vs inflation: So far, markets have largely treated the shock as predominantly inflationary, but prolonged disruptions could start to weigh on growth expectations, leading to a more complex risk‑asset response[7][9].
Simulated traders can use these variables to build scenarios: from “gradual de‑escalation and normalization of energy flows” to “prolonged standoff with intermittent supply disruptions.” Each scenario implies different paths for equities, FX, rates and commodities, which can be tested in a risk‑free environment before committing real capital.
Practical Takeaways For Simulated Traders
For participants in simulated finance platforms like E8 Markets, this episode offers several actionable lessons:
1. Separate the shock from the trend Initial geopolitical headlines often create sharp, short‑lived dislocations. As more information emerges, markets tend to revert toward underlying macro trends—earnings, employment, and structural investment themes[1][3]. Practice distinguishing transient risk premia from durable fundamentals.
2. Build crude‑centric macro maps Given oil’s central role, construct simple “oil‑up / oil‑down” macro maps linking crude prices to inflation expectations, central bank policy paths, sector performance and FX behavior[3][7][9]. Simulate trades that express these views across multiple asset classes, not just in energy futures.
3. Watch cross‑asset confirmation Don’t rely solely on equity indices to judge risk sentiment. In your simulations, track whether FX, rates and commodities are confirming the story. For example, a recovery in equities coupled with still‑elevated crude and strong safe‑haven demand may signal a fragile rebound.
4. Use scenario analysis, not single‑point forecasts Research suggests several plausible paths for the Iran conflict, each with different market outcomes[3][7][9]. Use SimFi tools to stress‑test portfolios under alternative oil price, volatility and growth assumptions. This builds discipline around risk management rather than “calling the market.”
5. Take advantage of mean‑reversion—but with guardrails Geopolitical relief rallies can be powerful, but they also carry the risk of “head fake” reversals if tensions flare up again. In simulated environments, experiment with position sizing, stop‑loss placement and diversification strategies that let you participate in mean‑reversion while limiting downside if the narrative turns.
By treating the current recovery not just as a news event but as a live case study in geopolitical risk pricing, traders can sharpen their macro intuition and develop more robust playbooks for future shocks.