Silver Takes a Dive: Breaking Through the $70 Barrier - A Turning Point or a Prelude?
A Sudden Descent: What Happened in March 2026?
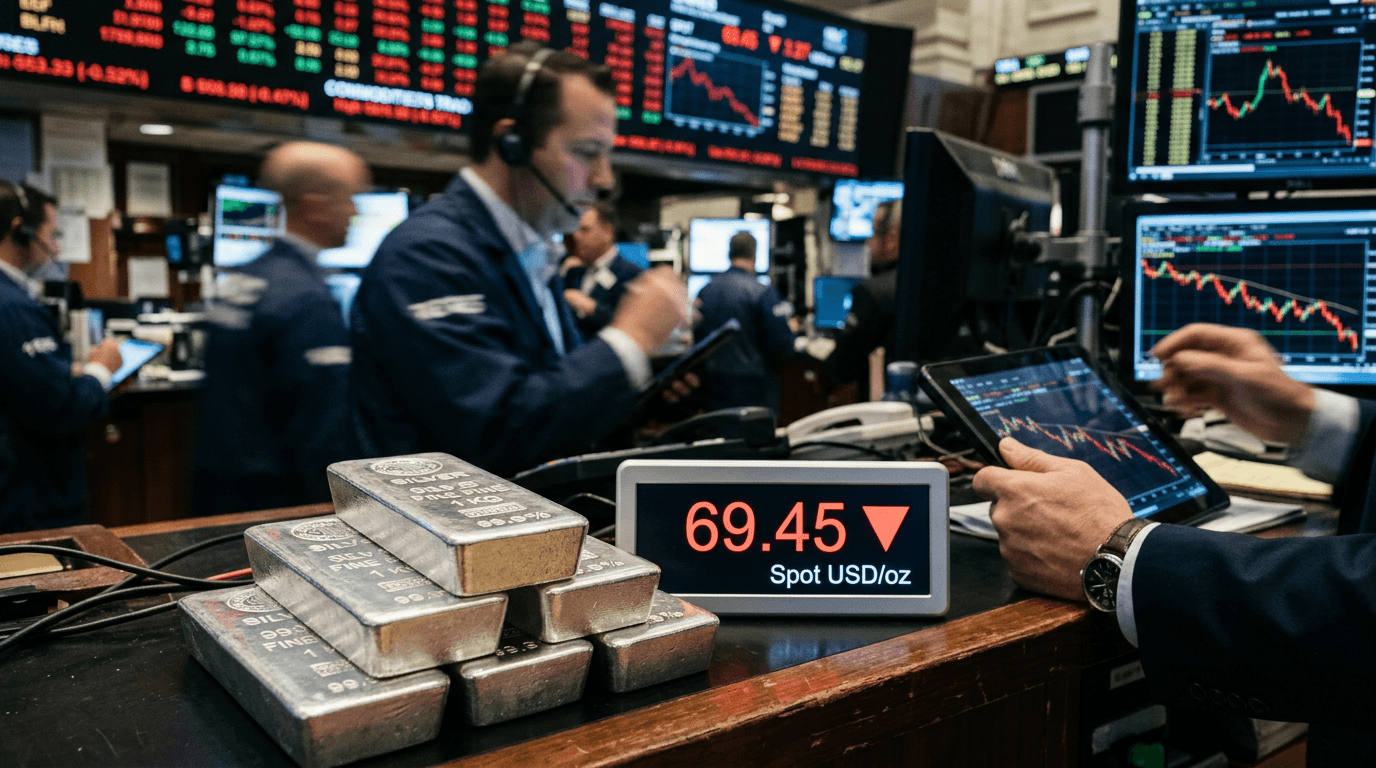
In March 2026, silver prices made headlines as they plummeted below the crucial $70 per ounce level—a psychological floor that investors had been eyeing all year. On March 19, spot silver fell to $66.93, marking one of the year's most abrupt multi-day downturns. This dramatic shift forced market players to rethink their strategies and evaluate whether this was a mere hiccup or the start of a more profound decline in precious metals.
The Catalyst for the Plunge: Fed's Hawkish Turn
The catalyst behind silver's steep fall was unmistakable: the Federal Reserve's hawkish pivot. By mid-March, the Fed decided to keep interest rates steady at 3.5% to 3.75%, signaling only a single rate cut for the year. This stance was due to ongoing inflationary pressures from high oil prices linked to tensions in the Strait of Hormuz. For silver, which had climbed from $40 to $121 per ounce over fourteen months on the back of dovish Fed expectations, this shift was a harsh reality check.
The narrative changed swiftly. Traders who had banked on an accommodative Fed suddenly faced a tough monetary environment. This led to a major repricing event across commodity markets, diverting funds from precious metals to higher-yielding assets. Silver, more sensitive to interest rate hikes than gold, bore the brunt of this shift.
Why $70 Matters: The Psychological Anchor
The $70 mark is not just another figure on a chart—it is a psychological and structural support level that has consistently shown its strength in 2026. Aligning with the December 2025 and February 2026 lows, this zone is recognized by technical analysts as a critical area of genuine buying interest.
When precious metals break through major round numbers like $70, it triggers a wave of sell-stops and margin calls among leveraged traders. The psychological impact of dropping below a round number intensifies selling pressure, creating a self-reinforcing downward spiral. Many retail investors and institutions use these round numbers as benchmarks, with stop losses set just below them. Silver's slip through $70 likely accelerated the sell-off.
Yet, this support level also offers a potential foundation for recovery. Silver's prior rebounds from the $70 mark twice in 2026 demonstrate that institutional buyers find this zone attractive. This tug-of-war will likely shape silver's trading range in the near term.
Gold-Silver Ratio and the Role of Paper Suppression
A glaring indicator of silver's weakness is the widening gold-to-silver ratio, now above 67. This ratio shows how many ounces of silver are needed to buy one ounce of gold. A dramatic widening implies that silver is underperforming gold and might be artificially suppressed compared to historical norms.
Analysts highlight the impact of leveraged paper contracts on COMEX exchanges as a factor in this weakness. Large-scale dumping of futures contracts can exert price pressure, disconnecting the paper market from physical realities. This artificial suppression is seen as temporary, and once the physical market asserts itself, those invested in real silver rather than paper derivatives might see substantial gains.
For serious investors, this suggests a potential disconnect between silver's paper price and its intrinsic value based on supply-demand fundamentals for industrial use.
Navigating Support Levels and Future Scenarios
On the downside, silver has potential support in the $65 to $68 range, which has held during previous sell-offs this year. If macroeconomic conditions worsen and deflation fears rise, the metal might test $60, a level with robust long-term historical support.
Conversely, if silver holds the $68 to $70 support zone and rebounds, resistance levels to watch are $80, followed by $88 to $90. Some analysts are bullish, with Deutsche Bank and Citigroup forecasting $100 per ounce by the end of 2026. These optimistic projections rely on industrial demand growth from solar and AI technologies, coupled with a return of the gold-to-silver ratio to its historical norm of 50.
Strategic Moves for Investors
For investors considering silver at these low levels, the risk-reward equation calls for careful thought. The industrial demand floor from solar panels, semiconductors, and AI applications offers downside protection, while the artificially suppressed paper market suggests significant upside potential if sentiment shifts.
Instead of trying to pinpoint the exact bottom, a phased accumulation strategy near these support zones may offer better risk management. Holding physical silver outside the banking system and watching for compression signals in the gold-to-silver ratio could be key to capitalizing on any recovery.
Key levels to monitor include $68 on the downside and $80 on the upside. If silver maintains a close above $75 to $77, the next major move could be significant.
In March 2026, silver slipped beneath the vital $70 psychological threshold following the Fed's hawkish stance. Explore the implications for precious metals and whether current prices signal opportunity or risk.
NEWSIMPACTSCORE: 7