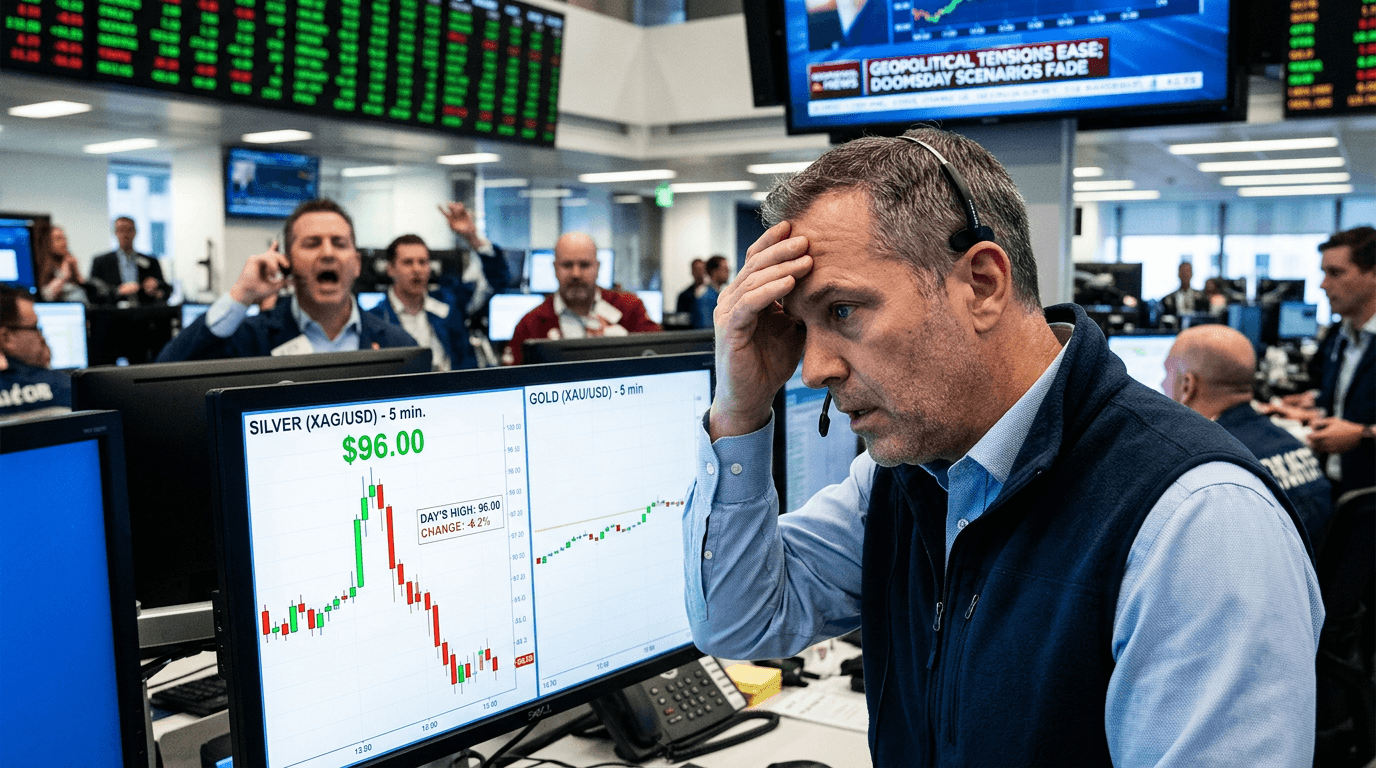
Silver prices soared to $96 in the immediate aftermath of US-Israeli strikes on Iran over the weekend, seemingly validating doomsday scenarios about Middle Eastern escalation. But the metal's euphoria proved short-lived. Within days, silver surrendered nearly all gains, plummeting 6% or more as markets reassessed the actual risk of broader regional conflict. The sharp reversal exposes a critical reality for traders: initial safe-haven rallies often unwind just as fast when the feared catastrophe fails to materialize. Understanding why silver sold off so aggressively requires looking beyond headlines into the metal's unique market dynamics and what the pullback signals about investor sentiment moving forward.
The Initial Spike: Safe-haven Rush And Doomsday Pricing
On February 28, US and Israeli forces conducted a massive coordinated strike on Iran, targeting over 2,000 positions including missile sites, navy bases, and the Natanz nuclear facility.[1] The death of Supreme Leader Ayatollah Ali Khamenei on day one of the offensive sent shockwaves through global markets. Investors immediately braced for full-scale regional war. The response was textbook fear trading: capital fled equities and poured into traditional hedges like gold and silver.[2]
Silver exploded higher, briefly touching $96.40 per ounce—a stunning move for a metal already up nearly 50% year-to-date.[1] Spot gold also surged, hitting intraday highs near $5,420, but the percentage gains in silver dwarfed the yellow metal.[1] This is not unusual when geopolitical shocks first hit. Safe-haven demand accelerates across all precious metals. The question was never whether they would spike—it was whether the spike would stick.
Why Silver Crashed Harder Than Gold
The reversal began almost immediately. By Tuesday, March 3, silver was down more than 10% from its spike highs, while gold retreated a more modest 4%.[4] This divergence holds an important lesson: silver is not pure safe-haven. It is half investment metal, half industrial commodity used in solar panels, electronics, and electric vehicles.[1]
When initial war fears fade and traders assess that Hormuz will stay open and supply chains will hold, the industrial demand side of silver deteriorates sharply. Recession concerns emerge. Central banks raise rates. Equity markets stabilize. Suddenly, the industrial demand destruction outweighs the safe-haven bid. Gold, by contrast, remains largely a store of value. It has no manufacturing use. It cannot be torn between competing narratives the way silver can.[1]
The gold-silver ratio compressed toward 57 during the spike, signaling that silver was leading as a pure safe-haven play.[1] But that compression proved unsustainable once doomsday fears faded. Investors rotated out, and silver paid the price.
TECHNICAL LEVELS AND THE $90 SUPPORT ZONE
The $90 level emerged as crucial support as selling accelerated.[1] Technical analysts currently identify $72 as a key support floor and $120 as the next major resistance target for 2026.[3] The breakdown from $96 to the high $80s tested trader patience, but failure to crack $90 decisively would suggest a floor is forming.
Understanding technical support matters in volatile markets because it is where algorithmic stops congregate. When enough traders have protective sells below key levels, any momentum down triggers cascading liquidations. Conversely, if price rebounds off support with volume, it can signal conviction from buyers. The next 48 hours will determine whether silver stabilizes above $90 or breaks lower toward the $72 support level.
Why Silver Remains Volatile But Underpinned By Structural Demand
Analysts remain divided on silver's trajectory. Forecasts for 2026 range wildly from a low of $49 to an aggressive $309, with most major banks clustering near $91 for the year-end average.[3] This disparity reflects genuine disagreement about whether industrial demand returns or recession derails the cycle.
But beneath the near-term noise sits a structural bull case. De-dollarization, persistent central bank buying, and endless government deficits have reignited interest in precious metals as portfolio insurance.[1] JPMorgan analysts flagged a 5% to 10% risk premium jump even before the Iran strikes and still eye $6,300+ longer term for gold.[1] Silver, while less institutionalized as a reserve asset, stands to benefit from synchronized upside if manufacturing confidence returns alongside safe-haven demand.
Lessons For Traders: Separating Noise From Signal
The silver crash teaches an essential lesson: initial war rallies are often trades to fade, not positions to hold through calm. If Trump's four-to-five-week timeline for resolution holds and Iran's regime cracks without permanently closing Hormuz, a sharp pullback is likely.[1] But if the standoff drags, oil prices stay elevated, inflation reignites, and the Hormuz corridor remains threatened, the structural bull case for both gold and silver accelerates.
Short-term, expect chop. Gold will likely hold above $5,200 even on de-escalation news, but silver remains the wild card with bigger upside on industrial demand stability and bigger drops if recession fears spike.[1] Traders should use any pullback toward $90 as a technical reference point, but focus portfolio allocation on the multi-month outlook where structural deficits and central bank buying remain the dominant narrative. The Iran shock provided a reminder that volatility sells faster than it buys—but the underlying bull market in precious metals endures.