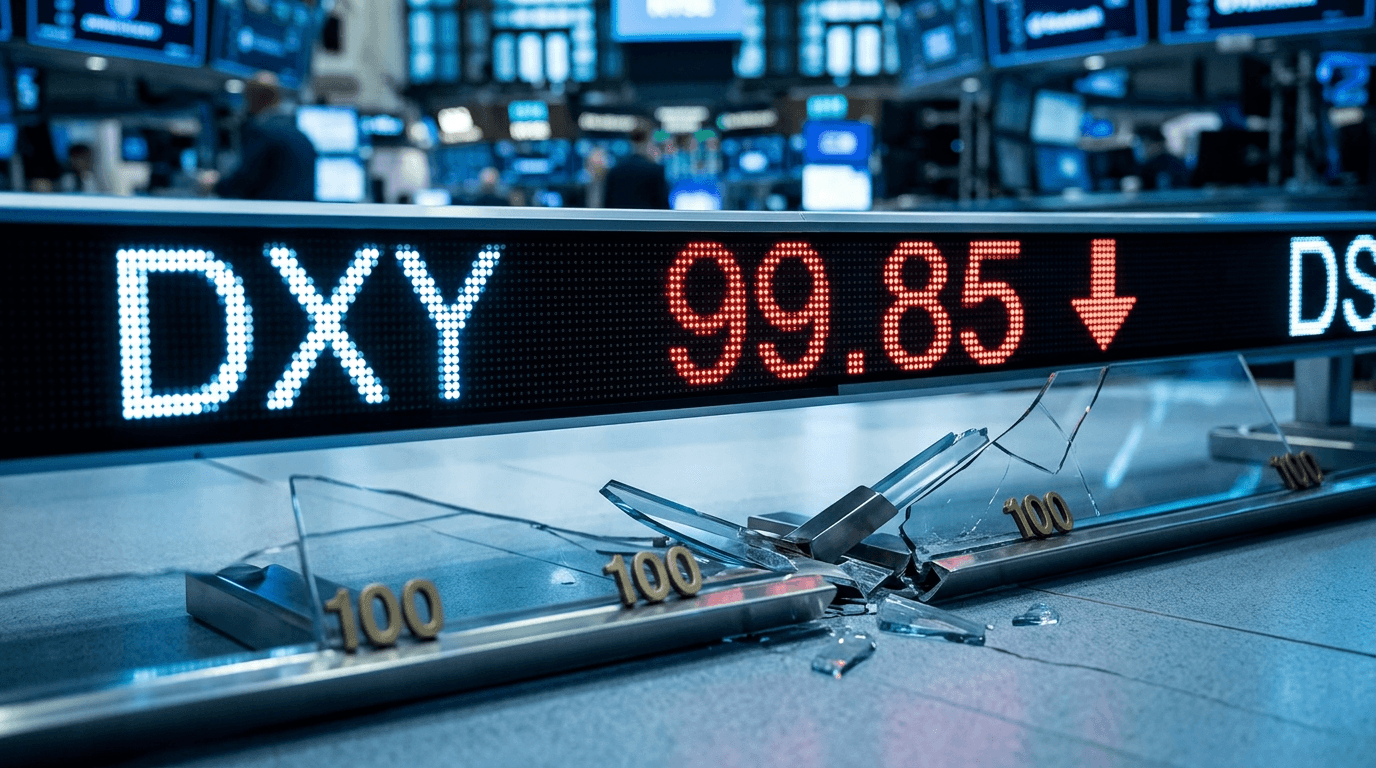
The US Dollar Index has dipped below a pivotal threshold that hasn't been breached since July 2023—it has slipped under the 100 mark. This isn't merely a numerical event; it signifies a crucial shift in market dynamics that traders and investors must grasp. The dollar's drop past this psychologically significant level signals underlying concerns about US economic growth, anticipated Federal Reserve policies, and the escalating uncertainties spawned by trade tensions and tariff strategies. For active traders and investment managers, this moment calls for close scrutiny, as it could herald shifts across multiple asset classes.
The Significance Of The 100 Level
The 100 mark on the US Dollar Index transcends being just a round number—it acts as a major psychological and technical benchmark that traders worldwide utilize to assess dollar strength or weakness. This level is a key reference for billions of dollars in algorithmic trading systems, risk management protocols, and global portfolio allocations. When the DXY trades above 100, it traditionally suggests robust strength in the US currency. Conversely, trading below it is interpreted as a shift toward dollar weakness, prompting a potential reevaluation of the rationale for holding dollars.
Earlier this year, the dollar soared to nearly 110, driven by expectations of continued Federal Reserve resolve and sustained interest rate vigor. The recent dip below 100 marks a stark reversal from those peaks, signaling a fundamental shift in market participants' outlook. This is particularly noteworthy because the index last consistently traded below this level during the aftermath of the 2008 financial crisis and the 2020 pandemic sell-off—periods marked by significant economic tumult and risk-off sentiment. The current breakdown suggests markets are anticipating similar economic challenges.
Economic Headwinds And Policy Uncertainty
The dollar's decline is intrinsically linked to the current economic landscape. While headline data hints at resilience in certain areas like employment, the underlying reality reveals mounting concerns. Core PCE inflation remains persistently above the Federal Reserve's target, constraining the Fed's ability to aggressively slash rates. Simultaneously, economic indicators are showing signs of slowing, with manufacturing metrics nearing contraction and softer growth signals emerging across various sectors.
This creates a challenging scenario known as stagflation—a blend of economic slowdown and persistent inflation. In this context, the dollar weakens not due to strength elsewhere but due to a convergence of factors: recession fears that dampen demand for US investments, uncertainty about the Fed's ability to cut rates amid sticky inflation, and the perception that other global economies may be more fragile than the US economy. Trade tensions and tariff policies have exacerbated these concerns, amplifying uncertainty about future economic growth rates.
Technical Breakdown And Key Support Levels
From a technical standpoint, the breach below 100 is a clear bearish signal. Charts display a pattern of lower highs and lower lows, indicating institutional selling pressure. The 50-day moving average has recently crossed below the 200-day moving average—a classic technical pattern known as a "death cross"—which traditionally signals sustained downward momentum.
For traders, the immediate downside support levels to watch are 99.70 and 98.50. A fall below 97.50 would indicate a deeper long-term trend reversal with potentially significant implications for capital flows across various asset classes. On the upside, the 100.20 to 100.50 range represents a potential recovery area, with resistance stretching toward 101.60 and 103. The 200-day moving average remains a critical focal point for traders evaluating whether this weakness is temporary or indicative of a more sustained reversal.
What This Means For Traders And Investors
The dip below 100 presents both challenges and opportunities, contingent on your positioning. A weaker dollar typically benefits certain commodity prices, emerging market currencies, and multinational companies with substantial overseas earnings. Conversely, it can pressure certain defensive trades and influence how investors allocate their currency exposure.
The critical variables moving forward will be economic data releases and Federal Reserve communications. Any unexpected strength in employment or inflation could swiftly reverse the dollar's decline and push it back above 100. Conversely, disappointing growth data or signs of accelerating disinflation could hasten the dollar's decline toward lower support levels. Geopolitical developments, particularly regarding trade negotiations and Middle Eastern tensions, will also significantly influence safe-haven flows into or out of the dollar.
Navigating The Uncertainty Ahead
This moment represents the kind of inflection point where market leadership can shift. The fall below 100 suggests that the era of dollar strength may be transitioning, at least temporarily, into a phase of consolidation or weakness. Astute traders are monitoring these support and resistance levels closely while remaining attuned to the economic calendar for data that could confirm or contradict the bearish technical signals currently manifesting.
The path forward heavily depends on which economic narrative prevails—either a soft landing where growth moderates but inflation trends lower without recession, or a harder landing scenario where the combination of tariffs and cooling activity pushes the economy into contraction. Until that narrative clarifies, expect ongoing volatility around the 100 level as the market seeks a new equilibrium.
NEWSIMPACTSCORE: 7