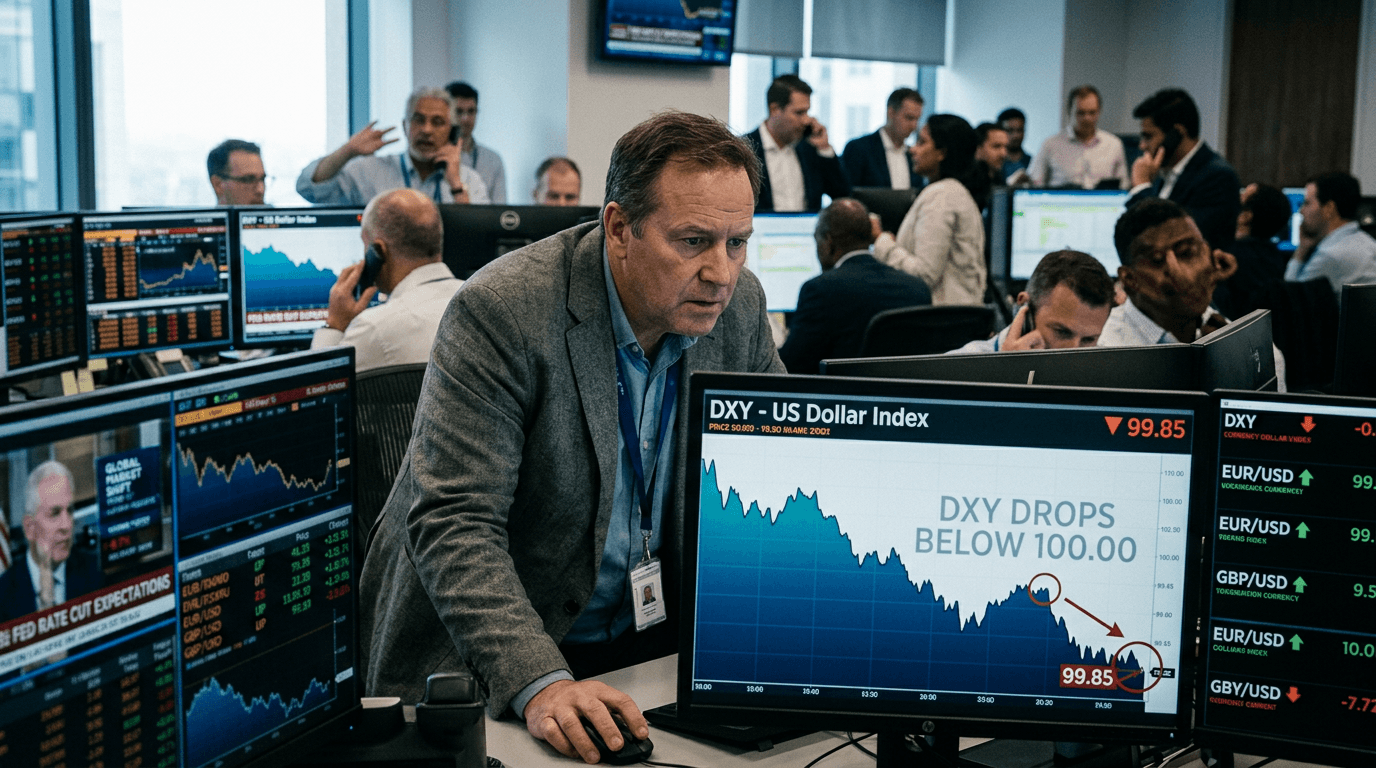
The US Dollar Index has breached a critical psychological barrier, falling below the 100 level for the first time since July 2023. This development signals a meaningful shift in global currency dynamics and marks a significant turning point for forex traders, portfolio managers, and anyone with exposure to US dollar strength. What started as a structural bull cycle for the dollar spanning from 2010 to 2024 has now reversed course, and the implications for your trading strategy are substantial.
The breakdown below 100 represents more than just a technical event—it reflects fundamental changes in market sentiment around US economic policy, inflation trajectories, and geopolitical tensions. The dollar index lost approximately 11% during the first half of 2025, marking its worst performance since 1973. This historical perspective underscores the magnitude of the current move and suggests traders should pay close attention to the factors driving this depreciation.
What's Driving The Dollar's Decline
Several interconnected factors have contributed to the dollar's weakness. Tariff tensions have created uncertainty around US economic growth, with markets pricing in potential headwinds from trade policy. While initial tariff implementation didn't immediately crater economic activity, the threat of escalating trade barriers continues to weigh on investor sentiment. Additionally, rising fiscal concerns and questions about the sustainability of current policy paths have reduced demand for dollar-denominated assets.
Technical analysis reveals that the DXY tested crucial support levels around 96.50 to 97.00 as it declined toward and through the 100 barrier. Pre-FOMC positioning created significant selling pressure, with traders adjusting their exposure ahead of Federal Reserve decisions. The combination of technical breakdowns and fundamental headwinds created a perfect storm for dollar weakness, with some analysts describing the move as a record-pace decline in recent weeks.
Current trading data shows the index fluctuating around the 98-98.5 level, suggesting consolidation following the sharp move lower. However, Morgan Stanley Research forecasts that the depreciation trend may continue, with the potential for an additional 10% decline by the end of 2026. This outlook implies we could test even lower levels, potentially approaching the 95.00 psychological support or the September 2025 FOMC lows near 96.20.
Key Technical Levels For Your Charts
Understanding the critical support and resistance levels is essential for positioning your trades effectively. The August range bull-bear pivot sits between 97.25 and 97.60, representing the first significant technical barrier. Above that, the 98.00 to 98.80 range contains several inflection points where buyers might defend the dollar or where sellers could intensify pressure.
The higher timeframe pivotal resistance sits between 98.80 and 99.00, while the psychological 99.50 level remains important for any attempted recovery. Looking higher, the January resistance around 99.40 to 99.50 and the November highs near 100.376 represent ambitious upside targets that would require a significant fundamental shift to challenge.
On the downside, the 2025 lows at 96.50 to 97.00 mark major support that, if broken, would likely lead to a retest of the 96.20 September FOMC lows. The psychological 95.00 level represents a key long-term support zone, though reaching it would indicate a dramatic continuation of the current trend. Most analysts expect a consolidation range between 96.80 and 97.30 in the near term, providing traders with clearer conditions for position management.
Implications For Emerging Markets And Portfolios
The dollar's weakness has created a significant tailwind for emerging markets, with portfolio inflows accelerating into EM assets as investors seek higher yields and exposure to markets less connected to US-centric risks. Currency depreciation typically benefits EM countries with strong export bases while increasing the burden on those with significant dollar-denominated debt. Currency pair traders should expect continued strength in EUR/USD and other dollar crosses, presenting opportunities in both established trends and mean-reversion trades.
For SimFi traders, this environment offers strategic opportunities to establish positions ahead of potential breakouts or breakdowns around critical levels. The technical setup combined with fundamental uncertainties creates multiple scenarios worth monitoring, particularly as major economic data releases and Fed communications shape market expectations.
What To Monitor Going Forward
The path ahead depends on several key variables: incoming US economic data, Fed communications, tariff policy developments, and global monetary policy divergence. A stronger-than-expected US economy could spark a recovery toward 99.00 and higher, while weakness would likely extend the downtrend. The FOMC remains crucial—market expectations around interest rate trajectories will heavily influence dollar demand.
Position yourself based on your risk tolerance and timeframe, but ensure you understand the technical levels that matter most. The consolidation between 96.80 and 97.30 may provide the best setup for trading decisions, as it offers clearer directional signals once the range is eventually broken.
The US Dollar Index's breakdown below 100 marks a transition from a long-standing structural trend. This shift creates opportunities for informed traders who understand both the technical landscape and fundamental drivers shaping currency markets in this dynamic environment.