Price Action: Strategies & Indicators
Introduction
Price action is the study of an asset’s raw price data over time, often visualized using candlestick charts. It’s a cornerstone of technical analysis, allowing traders to gain insights into market sentiment and potential future price movements. Unlike indicators that rely on calculations from past data, price action provides a direct reflection of the market’s current state. By understanding price action patterns, traders can make more informed decisions, identify trends, and uncover potential trading opportunities.
This article will guide you through essential price action concepts, strategies, and indicators. We’ll delve into candlestick patterns, support and resistance levels, trendlines, and price channels. You’ll learn how to apply these tools to develop effective trading strategies, manage risk, and navigate the dynamic world of financial markets.
Understanding Price Action
Price action analysis is both an art and a science. It involves a blend of technical knowledge, pattern recognition, and an intuitive understanding of market psychology. While there are well-established patterns and principles, successful price action traders often develop their own unique styles and interpretations.
- Candlestick Patterns: Candlestick charts are a powerful tool for visualizing price action. Each candlestick represents a specific time frame (e.g., minute, hour, day) and shows the open, high, low, and closing prices. Specific patterns within these candlesticks, such as hammers, dojis, and engulfing patterns, can indicate potential trend reversals or continuations.

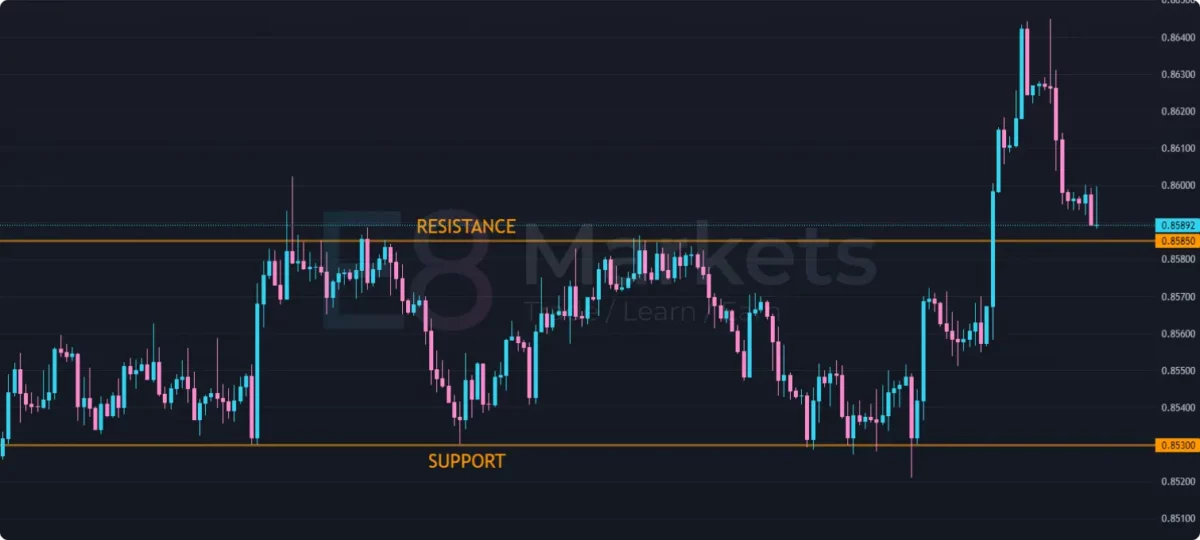
- Support and Resistance: These are crucial levels where price tends to stall or reverse. Support acts as a floor, preventing prices from falling further, while resistance acts as a ceiling, preventing prices from rising higher. By identifying these levels, traders can anticipate potential turning points and plan their entries and exits.
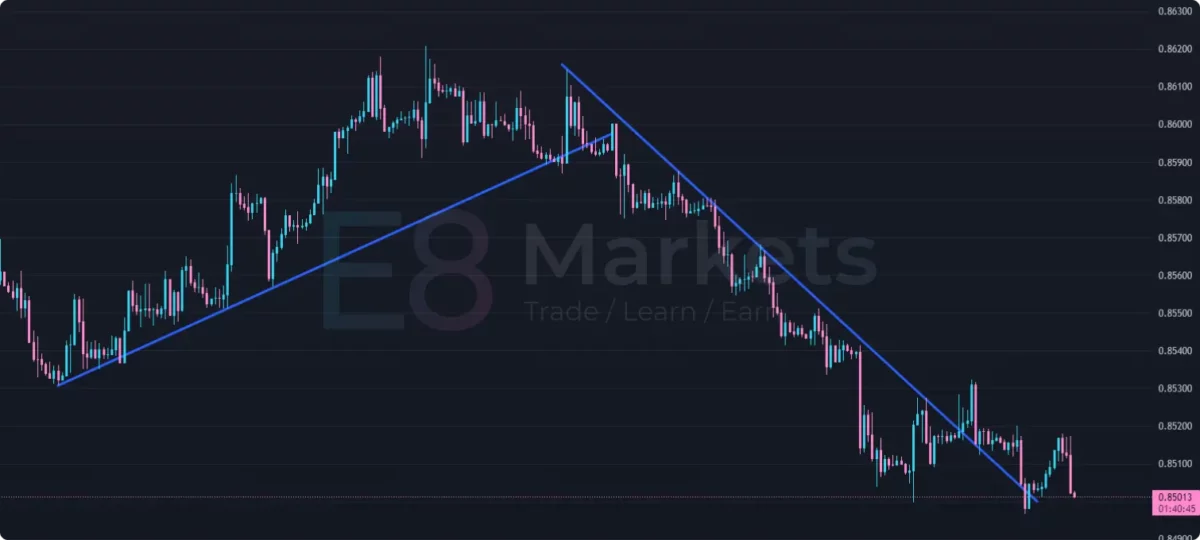
- Trendlines: Trendlines connect a series of higher lows in an uptrend or lower highs in a downtrend. They help visualize the direction and strength of a trend. When price breaks through a trendline, it may signal a potential trend reversal or a significant shift in market sentiment.

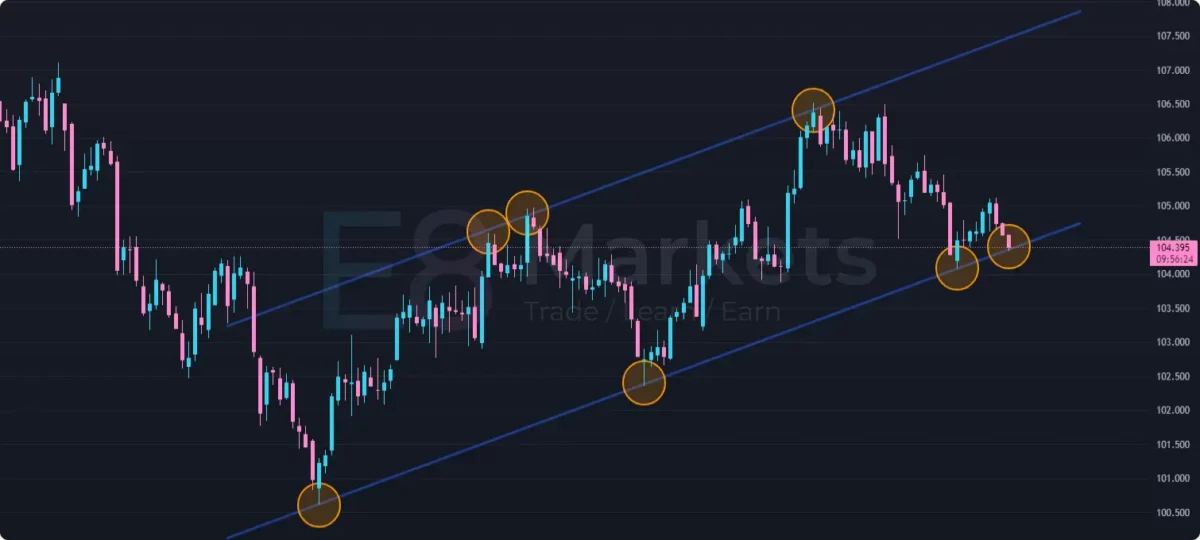
- Price Channels: These are formed by parallel trendlines drawn along the highs and lows of a price movement. Channels help traders identify potential areas of support and resistance and can be used to predict future price movements within the channel.
3 Simple Price Action Strategies
Price action analysis provides the foundation for a variety of trading strategies. Here, we’ll focus on three core approaches that leverage price patterns and key levels to identify potential trading opportunities.
1. Trend Trading:
Trend trading is a popular strategy that involves identifying and following the prevailing direction of the market. Traders aim to enter trades in the direction of the trend and join it for potential profits.
Identifying Trends: Trendlines are essential tools for identifying trends. In an uptrend, prices make higher highs and higher lows, forming an ascending trendline. In a downtrend, prices make lower lows and lower highs, forming a descending trendline.
Entry and Exit Strategies: Traders can use various entry strategies when trend trading. Some common approaches include:
- Buying when price bounces off an ascending trendline (uptrend)
- Selling short when price bounces off a descending trendline (downtrend)
- Entering on a pullback to a trendline, followed by a continuation of the trend
- Exit strategies can be based on predetermined profit targets, trailing stop-loss orders, or candlestick patterns that signal potential trend reversals.
2. Range Trading:
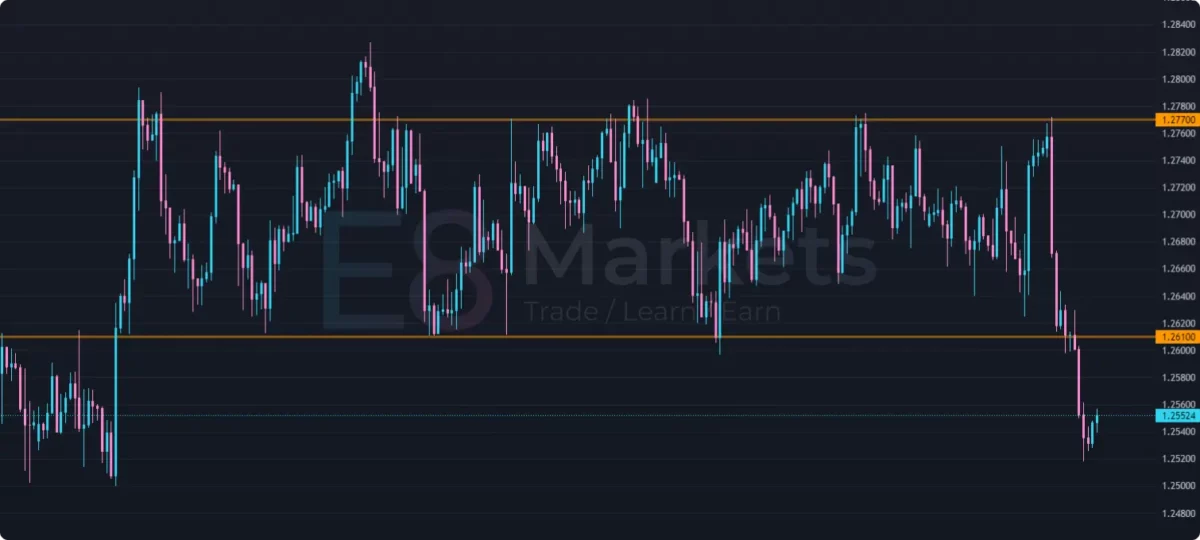
Range trading is a strategy employed when an asset’s price moves within a defined range, bouncing between support and resistance levels. Traders aim to buy near support and sell near resistance, profiting from the price oscillations.
Identifying Ranges: Ranges can be identified by drawing horizontal lines along the highs and lows of price action. The upper line represents resistance, and the lower line represents support.
Entry and Exit Strategies: Traders can enter long positions (buy) near the support level and exit (sell) near the resistance level. Conversely, they can enter short positions (sell) near the resistance level and exit (buy) near the support level.
Risk management is crucial in range trading, as breakouts from the range can occur. Traders often use stop-loss orders placed outside the range to limit potential losses.
3. Breakout Trading:
Breakout trading involves identifying and trading the moments when an asset’s price breaks out of an established range or pattern. Breakouts can signal a significant shift in market sentiment and can lead to substantial price moves.
Identifying Breakouts: Breakouts occur when the price moves decisively beyond a support or resistance level, often accompanied by increased volume. Traders can use candlestick patterns like the ascending triangle or the head and shoulders pattern to anticipate potential breakouts.
Entry and Exit Strategies: Traders typically enter trades in the direction of the breakout. Entries can be made immediately after the breakout, or traders can wait for a pullback to the breakout level for confirmation. Exits can be based on profit targets, trailing stop-loss orders, or candlestick patterns that signal potential reversals.
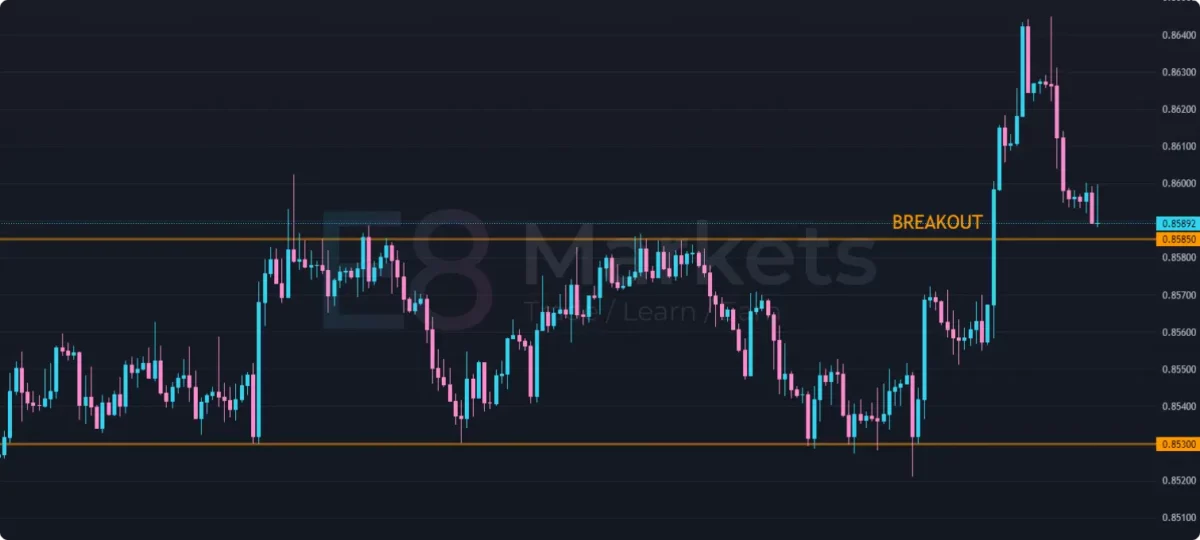
Risk management is crucial in breakout trading, as false breakouts can occur. Traders should be prepared to exit trades quickly if the breakout fails to gain momentum.
Price Action Indicators
While the core of price action analysis lies in interpreting raw price data, some indicators can offer valuable support and confirmation of price action signals. Here are a few key indicators that can be used in conjunction with price action strategies above:
1. Moving Averages (MA):
Moving averages smooth out price data over a specified period, helping traders identify trends and potential support or resistance levels.
Types of Moving Averages:
- Simple Moving Average (SMA): Calculates the average price over a set number of periods.
- Exponential Moving Average (EMA): Gives more weight to recent price data, making it more responsive to current market conditions.
Uses in Trend Trading Strategy:
- Identifying Trend Direction: A rising MA suggests an uptrend, while a falling MA suggests a downtrend.
- Dynamic Support and Resistance: MAs can act as dynamic support and resistance levels. Price bouncing off an MA may signal a continuation of the trend.
- Crossovers: Crossovers of different MAs can be used as potential buy or sell signals. For example, a shorter-term MA crossing above a longer-term MA might suggest a bullish trend.
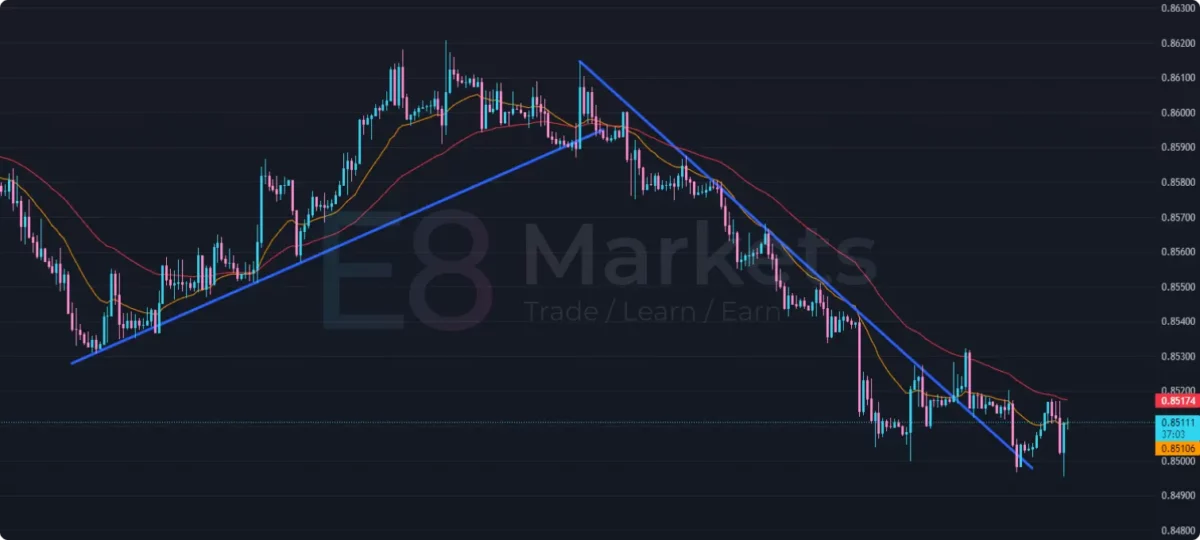
The chart above displays two Exponential Moving Averages (EMAs): a 50-period EMA in red and a 19-period EMA in orange.
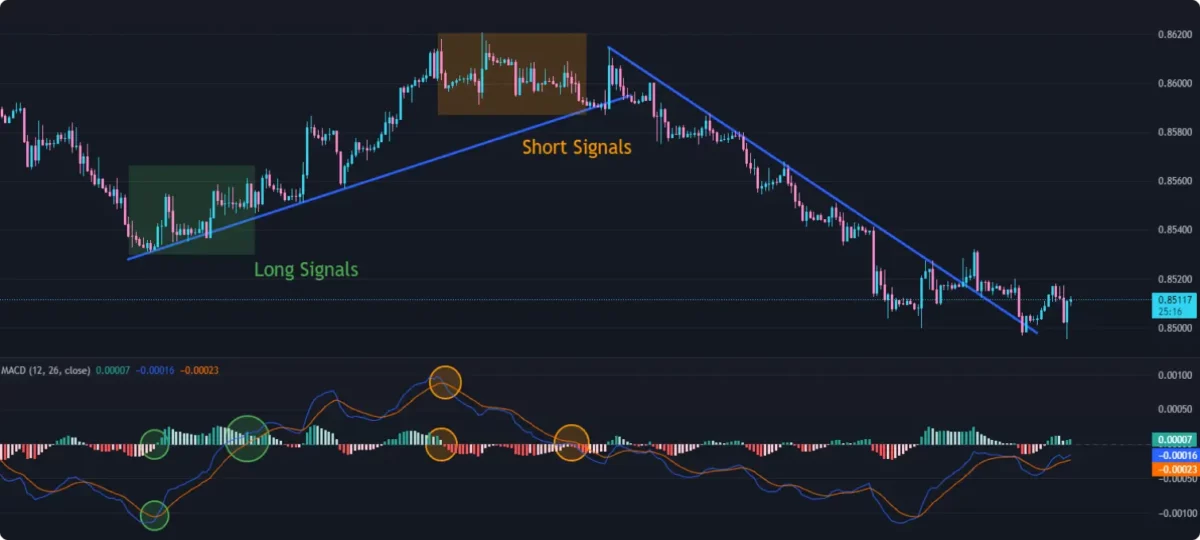
2. Moving Average Convergence Divergence (MACD):
The MACD is a versatile momentum indicator that shows the relationship between two exponential moving averages (EMAs) of an asset’s price. It consists of the MACD line, the signal line, and a histogram.
- MACD Line: The difference between a 12-period EMA and a 26-period EMA.
- Signal Line: A 9-period EMA of the MACD line.
- Histogram: The difference between the MACD line and the signal line.
Uses in Trend Trading Strategy:
- Crossovers: When the MACD line crosses above the signal line, it’s often interpreted as a bullish signal. When the MACD line crosses below the signal line, it’s often interpreted as a bearish signal.
- Centerline Crossovers: When the MACD line crosses above or below the zero line, it can indicate a shift in momentum. Crossing above the zero line suggests increasing upward momentum, while crossing below suggests increasing downward momentum.
- Divergence: Divergence between the MACD and price can signal a potential trend reversal. For example, if price makes a lower low, but the MACD makes a higher low, it might suggest a weakening downtrend.
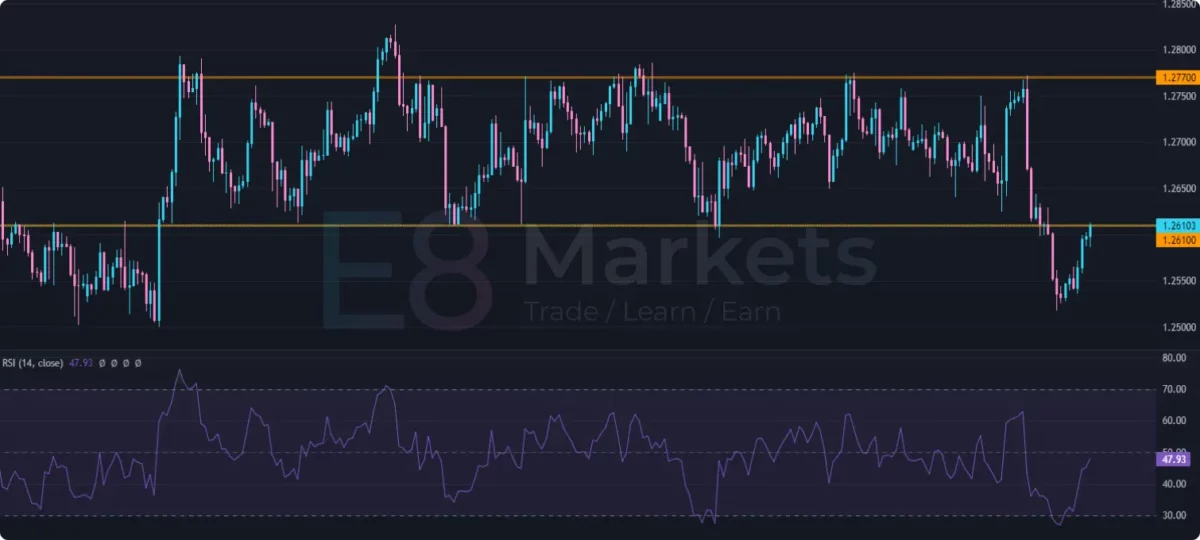
3. Relative Strength Index (RSI):
The RSI is a momentum oscillator that measures the magnitude of recent price changes to assess overbought or oversold conditions in the market.
Overbought and Oversold Levels: The RSI ranges from 0 to 100. Readings above 70 typically suggest overbought conditions (potentially indicating a price reversal), while readings below 30 suggest oversold conditions (potentially indicating a price bounce).
Uses in Range Trading Strategy:
- Confirming Price Action Signals: A bullish candlestick pattern forming in oversold territory (low RSI) might be a stronger buy signal than the same pattern forming in overbought territory (high RSI).
- Divergence: Divergence between price and RSI can signal a potential trend reversal. For example, if price makes a higher high, but RSI makes a lower high, it might suggest a weakening uptrend.
Putting It All Together
Throughout this article, you’ve gained a comprehensive understanding of price action concepts, strategies, and indicators. From identifying candlestick patterns to deciphering trendlines and utilizing indicators like the MACD and RSI, you now have a toolkit to analyze markets and make more informed decisions.
Remember, the scenarios we discussed for each strategy and indicator weren’t just theoretical exercises. They represent situations where price action analysis can provide a significant edge. By applying these principles, you can spot potential trend reversals, identify breakout opportunities, and trade within established ranges.
Risk Management: A Cornerstone of Success
No trading strategy is complete without a robust risk management plan. Price action can help you identify potential entry and exit points, but it’s equally important to define your risk tolerance and protect your balance.
Setting stop-loss orders is crucial for limiting losses. Place stop-loss orders at strategic levels based on your analysis of support and resistance or recent price action. This ensures that you automatically exit a trade if the market moves against you, preventing excessive losses.
Determining the appropriate position size for each trade is another vital aspect of risk management. Avoid risking too much of your capital on any single trade. Consider factors such as your account size, risk tolerance, and the volatility of the asset you’re trading.
Additional Tips for Successful Price Action Trading
- Backtesting: Before implementing any price action strategy, it’s crucial to backtest it on historical data. This allows you to evaluate its performance, refine your approach, and gain confidence in your trading plan.
- Multiple Timeframes: Analyze price action on multiple timeframes to gain a broader perspective. A longer-term timeframe can help you identify the overall trend, while shorter-term timeframes can provide insights into potential entry and exit points.
- Confluence: Look for the confluence of multiple price action signals. For example, a bullish candlestick pattern forming near a support level with increasing volume could be a stronger buy signal than any of these factors in isolation.
- Other Forms of Analysis: While price action is a powerful tool, consider incorporating other forms of analysis, such as fundamental analysis or sentiment analysis, to gain a more comprehensive view of the market.
- Discipline and Emotional Control: Successful trading requires discipline and emotional control. Stick to your trading plan, avoid impulsive decisions, and manage your emotions effectively.
By incorporating these risk management practices and additional tips into your price action trading approach, you can increase your chances of success and navigate the markets with confidence.
Conclusion
Price action is more than just a set of technical tools; it’s a philosophy of trading that empowers you to understand the market on its own terms. By focusing on raw price data, recognizing patterns, and interpreting key levels, you gain a unique perspective that complements traditional indicators.
Remember, price action is not a magic formula for guaranteed success. However, it offers a powerful framework for making informed decisions, managing risk, and navigating the complexities of financial markets. Like any skill, mastering price action takes time, practice, and continuous learning.
By dedicating yourself to understanding the core principles and experimenting with various strategies, you can develop your own unique approach to trading. With discipline, patience, and a commitment to ongoing learning, you can leverage price action to unlock the potential of the markets and achieve your trading goals.
Embark on your price action journey today. Explore, experiment, and discover the insights that lie within the charts. The markets are constantly evolving, and with price action as your guide, you’ll be well-equipped to adapt, evolve, and thrive.
We hope this guide has been helpful in introducing you to the world of price action. Feel free to reach out to E8 Markets for further resources and guidance on your trading journey.
Remember, the best way to learn is by doing. So, start applying these concepts, backtest your strategies, and refine your approach. The more you practice, the more confident and proficient you’ll become.
Ready to Put Price Action into Practice?
Eager to test your newfound knowledge of price action strategies and indicators? E8 Markets offers a risk-free environment to do just that with our Trial Account.
Our Trial Account gives you access to:
- Real Market Data: Practice your skills with live market data, mirroring real trading conditions.
- Charting Tools: Utilize a wide array of charting tools and indicators to analyze price action.
- Simulated Trading: Execute virtual trades to test your strategies without risking real capital.
Take the Next Step:
Don’t miss the opportunity to hone your price action skills and develop a profitable trading strategy. Open your E8 Markets Trial Account today and start your journey toward becoming a more confident and profitable trader.
Click here to create your E8 Markets Trial Account and start exploring the power of price action today!
Article topics
Trade with E8 Markets
Start our evaluation and get opportunity to start earning.


Disclaimer
The information provided on this website is for informational purposes only and should not be construed as investment advice. Always conduct your own research and consult with a qualified financial advisor before making any investment decisions. We do not endorse or promote any specific investments, and any decisions you make are at your own risk. This website and its content are not responsible for any financial losses or gains you may experience.
Please consult with a legal professional to ensure this disclaimer complies with any applicable laws and regulations in your jurisdiction.