
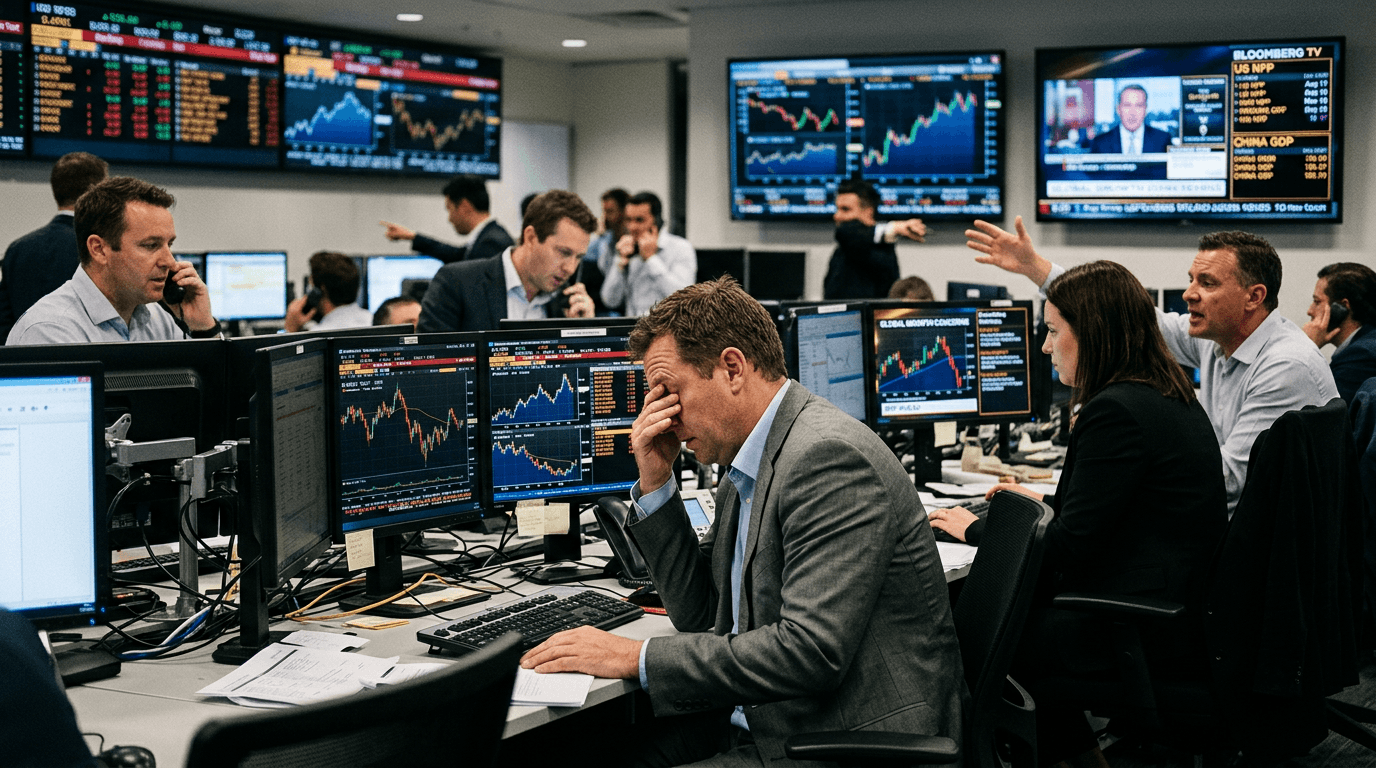
The Australian dollar’s latest pause near 0.69 against the US dollar is less about calm and more about caution. Traders are stepping back from cyclical currencies like AUD ahead key US jobs data, while global growth worries cast a longer shadow over risk assets, including Asia‑Pacific FX. With short‑term momentum indicators turning lower and domestic data no longer offering a strong cushion, the balance of risk around AUD/USD is tilting to the downside.[10][3][7]
CURRENT AUD/USD LANDSCAPE
AUD/USD is currently trading in a tight range around 0.6900, with downside attempts contained near 0.6865 and rallies capped below 0.6930.[10] Major currency data providers show the pair holding close to this zone, with mid‑market quotes clustering around 0.689–0.696, underscoring how the market has stalled just under the 0.70 threshold.[1][7][9][3][5][6] This sideways action follows a near 4% decline in June, a reminder that the recent consolidation is occurring after a meaningful drawdown rather than at the top of a trend.[10]
Technically, the flat price action around 0.69 is accompanied by short‑term moving averages starting to roll over, with the 20‑day EMA turning lower and signalling fading upside momentum. This shift matters because the 20‑day EMA often acts as a dynamic trend filter; when it bends down after a strong run, it frequently marks the transition from “buy the dip” to “sell the rally” behaviour among short‑term traders.
Broader technical structures still show AUD/USD above key medium‑term moving averages between roughly 0.66 and 0.69, suggesting the longer‑term uptrend is not yet broken, even as the pair consolidates.[4] In other words, near‑term charts warn of growing downside risks, but the bigger picture has not flipped decisively bearish—yet.
On the fundamental side, domestic data has not helped AUD. Australia’s latest trade figures delivered an unexpected deficit of around AUD 3 billion, in contrast to the surpluses that have often supported the currency in recent years.[10] This weaker external balance reduces one traditional pillar of AUD strength at precisely the time global demand concerns are rising.
Us Nfp As A Key Catalyst
The immediate risk event for AUD/USD is the US Nonfarm Payrolls (NFP) release. NFP measures monthly US jobs growth and is one of the most closely watched data points for the Federal Reserve and global markets. A stronger‑than‑expected print tends to support the US dollar and can trigger a “risk‑off” reaction if traders conclude that higher US rates will persist longer, tightening global financial conditions.
For AUD, which trades as a pro‑growth, risk‑sensitive currency, that combination of a stronger USD and cautious risk sentiment can be doubly negative. In such a scenario, AUD/USD may test and potentially break below the current 0.6865–0.6890 support band, opening the door to deeper retracements toward previous medium‑term support zones.[10][4]
Conversely, a weaker NFP outcome could pressure the US dollar and initially lift AUD/USD. However, the interpretation is not always straightforward. If a soft jobs report reinforces fears of slowing US growth, risk sentiment can suffer, which may limit AUD’s relief rally or make it short‑lived. Traders need to think not just about the headline number, but about how markets connect it to the broader growth narrative.
The key takeaway: NFP is not just about direction; it’s about volatility. For AUD traders, the release often brings sharp swings, slippage, and widened spreads, making position sizing and execution quality critical considerations.
Global Growth Worries And Cyclical Currencies
Beyond the single data point of NFP, the larger story is global growth uncertainty. AUD is heavily tied to global demand through commodities and trade with Asia, particularly China. When investors grow more cautious on the world growth outlook, they typically trim exposure to cyclical currencies like AUD, NZD, and some emerging‑market FX, rotating instead into defensive assets and core currencies.
Current positioning reflects this dynamic. Traders have been reducing exposure to Asia‑Pacific FX and related futures, not because they see an immediate crisis, but because the balance of risks has shifted: weaker trade data, softer industrial activity in key economies, and persistent geopolitical tensions make the global demand outlook more fragile.[10][4][8] This environment tends to cap rallies in AUD and makes any upside more reliant on idiosyncratic positive surprises.
At the same time, sticky domestic inflation and a Reserve Bank of Australia that remains relatively hawkish provide some underlying support, limiting how far AUD can fall without a more dramatic deterioration in global conditions.[4] This push‑and‑pull—global growth worries versus a still‑firm RBA stance—is one reason AUD/USD has stalled rather than collapsed at 0.69.
Key Levels And Trading Setups
For traders, the current structure around AUD/USD presents a clear set of technical reference points. On the downside, the immediate supports sit near 0.6865–0.6890, which have contained recent selling attempts.[10][3][4] A decisive break below this area on a strong US‑dollar or risk‑off move would be a meaningful bearish signal, likely attracting trend‑following strategies and potentially accelerating downside.
On the upside, the first hurdle is the 0.6930 region, which has capped recent rallies.[10] Above that, previous support and Fibonacci zones around 0.6975–0.7000 become important; reclaiming and holding above these levels would suggest the recent pullback was more consolidation than trend change.[4] Until then, the market may see 0.69–0.70 as a “distribution zone,” where rallies are sold rather than chased.
In practical terms, many short‑term traders will look to trade breakouts from the current range around NFP, while more conservative participants may prefer to wait for the dust to settle and then fade overstretched moves back toward established levels. In both cases, defined entry and exit criteria, along with strict risk limits, are crucial.
Practical Takeaways For Traders And Simfi Participants
For active traders and SimFi participants, this backdrop offers a useful live case study in event‑risk management and macro‑FX dynamics.
First, treat the AUD’s stall at 0.69 as a signal, not noise. It reflects genuine uncertainty about the interplay between US labour data, Fed policy expectations, and global growth—not just random sideways price action.
Second, build scenario plans around NFP. Map out how you would respond if the data is significantly stronger, broadly in line, or notably weaker than consensus. Consider implications for the US dollar, risk sentiment, and key AUD/USD levels, and test those scenarios in a simulated environment before committing capital.
Third, respect volatility. During major data releases, spreads can widen and slippage can increase, making tight stops more likely to be triggered and entries less precise. Adjust position sizes, avoid over‑leverage, and be comfortable with the idea that sometimes the best trade around such events is no trade.
Finally, keep the global picture in view. AUD is more than just a rate differential story; it sits at the intersection of commodities, China‑linked demand, and global risk appetite. Watching trade data, Chinese activity indicators, and broader risk sentiment alongside US releases will provide a richer framework for interpreting moves around 0.69.