Bitcoin has reclaimed the $71,000 level in recent trading sessions, marking a crucial psychological barrier that traders have monitored closely. This price point represents more than just a number—it's a technical and psychological pivot that's been tested multiple times over recent weeks. While the world's leading cryptocurrency has demonstrated resilience in holding above this threshold, underlying market dynamics suggest caution is warranted. The path forward depends heavily on whether Bitcoin can consolidate above $71,000 or if mounting headwinds could trigger another pullback.
Understanding The Consolidation Pattern
The current market structure shows Bitcoin trapped in a defined consolidation range between approximately $65,000 support and $72,000 resistance. This broad trading band represents weeks of price discovery following the sharp decline from February lows. The $71,000 level sits at the upper boundary of this range, making it a natural resistance point where profit-taking often occurs. Technical analysis reveals that Bitcoin's 50-day and 200-day simple moving averages have realigned in a bullish configuration, providing intermediate support for continued strength.
From a technical perspective, breaking above $72,000-$73,000 would open the door to testing the heavier supply zone near $78,000-$80,000, where prior selling pressure accelerated during the recent downturn. However, traders should recognize that this resistance zone represents substantial profit-taking territory. On the downside, the first significant support sits at $68,000, with stronger structural support anchored at $65,000 where multiple tests have occurred.
Institutional Participation And Etf Momentum
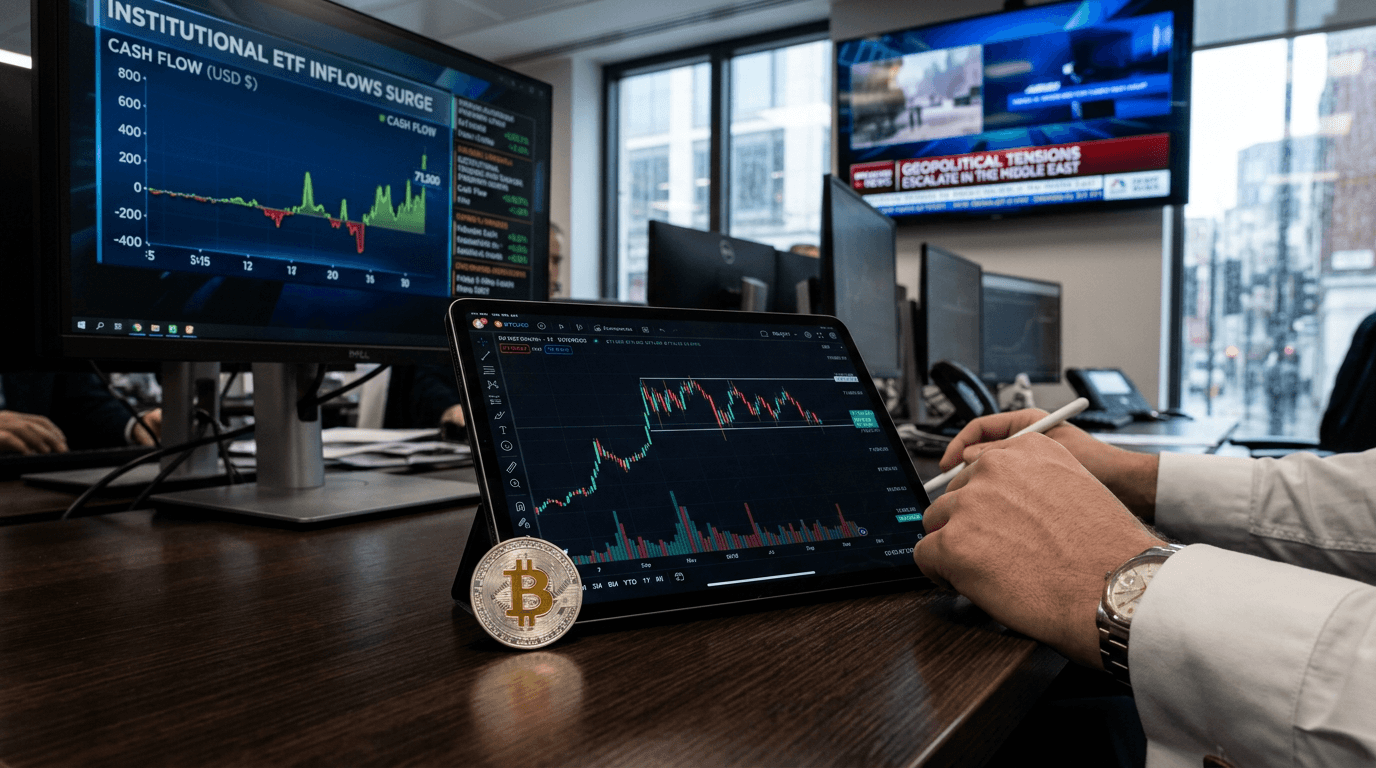
One of the most bullish signals supporting Bitcoin's ability to hold above $71,000 comes from institutional capital flows. US spot-Bitcoin ETFs have experienced substantial net inflows exceeding $3.3 billion in recent periods, indicating that traditional financial institutions continue to view current levels as entry points. This institutional participation contrasts sharply with pure speculative behavior and suggests a foundation of committed capital.
On-chain data further reinforces this narrative. Exchange inflows have dropped to historically low levels around 28,235 BTC, a pattern typically associated with reduced selling pressure and potential accumulation phases. When fewer coins flow into exchanges, it often signals that holders are becoming increasingly reluctant to sell, which typically precedes price appreciation. The confluence of strong ETF inflows and declining exchange inflows paints a picture of accumulation rather than distribution.
Crypto-related equities have responded accordingly. Companies like Microstrategy, Coinbase, and other publicly-traded cryptocurrency firms have seen double-digit percentage gains when Bitcoin breaks above $71,000, reflecting investor confidence that institutional adoption remains a tailwind for the sector.
Geopolitical Pressures And Macro Concerns
Despite the technical and institutional positives, significant risks loom over the broader market. Recent geopolitical tensions, particularly escalating Middle East situations, have weighed on risk asset appetite globally. During periods of geopolitical stress, investors typically rotate away from speculative assets like cryptocurrencies and toward safe-haven holdings like US Treasury bonds and gold.
The cryptocurrency market remains sensitive to broader macroeconomic conditions. Weak economic data, potential interest rate decisions, and corporate earnings reports can trigger rapid reversals in sentiment. Bitcoin's recent climb from its 40% retreat from all-time highs demonstrates that while institutional money is flowing in, the market remains fundamentally vulnerable to external shocks.
Additionally, the relationship between Bitcoin and technology stocks remains strong. When equity markets experience significant selloffs, Bitcoin often follows despite its status as a supposed alternative asset class. This correlation creates systematic risk that traders cannot easily diversify away.
Critical Levels To Monitor
For traders seeking actionable guidance, several key metrics warrant close attention. The $72,000-$73,000 zone represents the immediate resistance level that Bitcoin must decisively break through to signal more substantial upside potential. Until this happens, expect consolidation and potential pullbacks toward $68,000-$70,000.
The Balance of Power technical indicator has turned positive in recent sessions, suggesting short-term buyer momentum is strengthening. However, this indicator is primarily useful for intermediate-term positioning rather than long-term conviction. Volume patterns should be monitored closely—breakouts accompanied by surging trading volume carry more conviction than moves on declining volume.
Keep watch on liquidation data as well. Recent on-chain data showed over $100 million in liquidations, with the majority stemming from short positions. While this supports short-term upside, it also indicates that significant leverage is involved in current buying pressure, which can reverse rapidly.
The Path Forward
Bitcoin holding above $71,000 represents meaningful progress from February's capitulation lows, but traders should avoid overconfidence. The current environment combines bullish institutional flows with bearish geopolitical risks and macro uncertainty. This creates a knife-edge equilibrium where small catalysts could push the market decisively in either direction.
The smart approach involves respecting key technical levels while maintaining appropriate position sizing. Neither aggressive long positioning nor capitulation selling makes sense at these levels. Instead, traders should wait for clearer directional conviction above $73,000 or below $68,000 before committing substantial capital.