
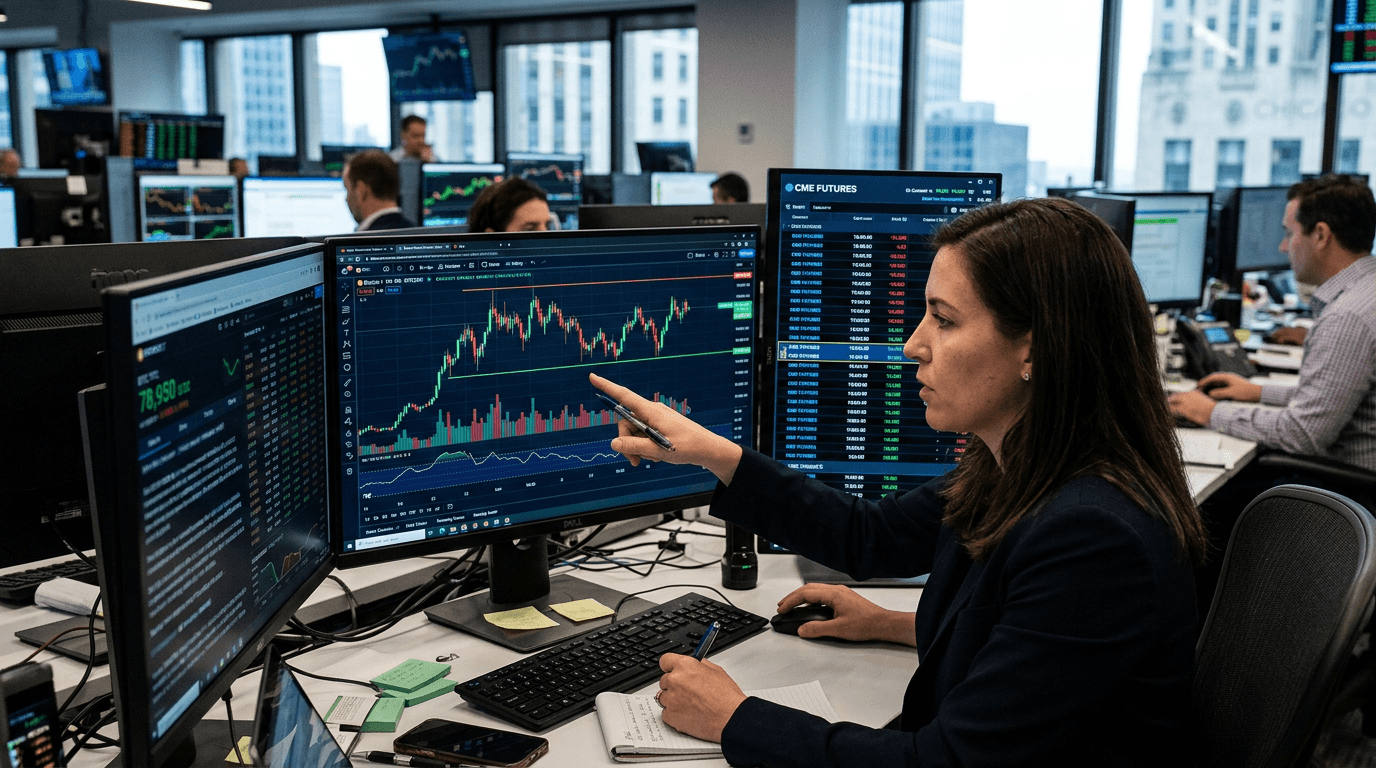
Bitcoin is once again trading in rarefied air, holding near the 78,000–80,000 range after briefly pushing above 80,000 and resetting to around 78,000–79,000.[5][11][12][14] CME front‑month bitcoin futures are trading close to 79,000, keeping futures and spot markets tightly aligned as bullish demand from funds and ETF flows continues to underpin the move despite elevated intraday volatility.[3][10][11][12] For traders, this is a textbook environment to study how leverage, liquidity, and sentiment interact when an asset sits just under a major psychological level.
MARKET SNAPSHOT: BTC AND FUTURES AROUND 78K–80K
Spot bitcoin has spent recent sessions oscillating roughly between 77,000 and just above 80,000, with many data providers placing current prices near 78,000–78,800.[4][5][11][12][15] The market has already tested above 80,000—printing highs in the 80,000–81,000 region—before profit‑taking dragged it back into the high‑70,000s.[12][14][15] This back‑and‑forth around a clear ceiling is typical of a market deciding whether a new leg higher is justified or whether a larger consolidation is needed.
On the futures side, CME bitcoin contracts are priced only slightly above spot, with front‑month around 79,000.[3][10][11] That modest positive basis (futures > spot) reflects healthy bullish positioning without the extreme premiums seen in overheated, late‑cycle phases of past bull markets.[3][10] Crypto derivatives venues also show elevated open interest and still‑supportive funding rates, reinforcing that leveraged long exposure remains significant.[2][9][13]
Key takeaway: The tight spread between spot and futures plus elevated open interest indicates a strong but not yet euphoric bullish phase—a market where tactical timing matters as much as direction.
WHAT’S DRIVING THE BULLISH DEMAND?
Several forces are feeding demand at these levels. Bitcoin has just come off one of its strongest weekly advances in years, lifting it back toward 80,000 for the first time since mid‑May and marking a three‑month high.[12][14][15] That rally was strong enough to trigger liquidations of billions of dollars in leveraged positions, flushing out weaker hands and resetting positioning while price stayed near the highs.[9][14]
Fresh inflows into bitcoin funds and spot ETFs have helped absorb selling and keep dips shallow, with institutional and systematic buyers acting on macro catalysts and trend‑following signals.[11][12] Regulatory headlines and the perception of bitcoin as a hedge against policy uncertainty have added a macro tailwind, supporting sustained interest rather than purely speculative spikes.[11][12][14] Technically, traders are watching the 79,000–80,000 band as a key resistance zone; a decisive break could open paths toward 82,000–83,000 and beyond.[1][4][7][13]
Key takeaway: Demand is not coming only from retail momentum; structured flows via funds, ETFs, and derivatives desks are playing a central role in keeping bitcoin anchored near 80,000.[11][12]
How Futures Pricing Signals Market Expectations
Futures pricing offers clues about how traders expect this regime to evolve. With CME front‑month contracts hovering close to spot, the market is signaling modestly higher prices ahead, but not a runaway spike.[3][10][11] In periods of mania, futures can trade at steep premiums as traders overpay for exposure; that is not the current setup.
The term structure across crypto derivatives venues shows mild contango (later‑dated contracts trading above near‑term), consistent with expectations of gradual appreciation rather than an immediate vertical move.[2][3][13] At the same time, high open interest and positive funding rates show that leverage is skewed long, which can amplify both rallies and corrections.[2][9] When prices briefly dropped back below 78,000 after rejecting above 81,000, for example, long liquidations quickly reached hundreds of millions of dollars before the market stabilized near support.[9][14]
Key takeaway: Current futures pricing reflects constructive optimism, but the buildup of leveraged longs means any failed breakout above 80,000 can trigger sharp, fast downside moves.
Trading Implications: Risk, Leverage And Scenarios
Price action around 80,000 is shaping three main scenarios that futures and spot traders should prepare for.
1. Clean breakout: A strong daily close above 79,500–80,000 with follow‑through could ignite a squeeze toward the low‑80,000s, especially as short positions between roughly 77,000 and 78,000 are forced to cover.[1][7][13] This would likely be accompanied by another wave of liquidations and widening futures premiums.
2. Range continuation: Bitcoin has repeatedly oscillated between the mid‑70,000s and 80,000, with support zones flagged near 75,000–77,000 and deeper cushions around 74,000.[2][4][6][9] In this scenario, the market chops sideways as positioning normalizes and macro inputs (such as economic data or regulatory headlines) set the next directional cue.
3. Failed breakout and deeper correction: A decisive rejection near 80,000, especially if coupled with risk‑off sentiment across broader markets, could drag price back toward 72,000–74,000 where stronger historical demand emerged.[2][4][6][9] Given the leverage in the system, this path would likely feature spiky volatility and rapid intraday swings.
In all three scenarios, the core risk driver is position sizing relative to volatility. With bitcoin trading this high in absolute dollar terms, a 5% intraday move represents nearly 4,000 points—a large move for any account using futures or margin.
Key takeaway: Defining clear invalidation levels, limiting leverage, and planning for large intraday swings are essential when trading near major psychological thresholds like 80,000.
HOW SIMULATED FUTURES (SIMFI) CAN HELP TRADERS PREPARE
Simulated finance environments allow traders to rehearse these scenarios using live market conditions but without real capital at risk. With bitcoin and crypto futures near 78,000–80,000, traders can simulate breakout, range, and breakdown strategies and see how P&L behaves under different leverage and risk‑management rules.
For example, a trader might backtest and forward‑test a breakout system that buys a daily close above 80,000 with a stop below 77,500, then track how often slippage, gaps, or liquidation risk impact performance when volatility spikes.[1][4][9] Another trader could practice market‑making or mean‑reversion strategies within the 76,000–80,000 range, monitoring how quickly unrealized profits can evaporate when a genuine trend day emerges.[2][4][6]
Because crypto trades around the clock, SimFi is particularly valuable for testing how overnight margin, funding rate shifts, and news shocks affect leveraged positions. Traders can experiment with rules like maximum drawdown per day, automatic de‑leveraging after a series of losses, or dynamic position sizing based on realized volatility, then refine those rules before applying them to live accounts.
Key takeaway: Use simulated futures trading to stress‑test strategies, understand liquidation dynamics, and calibrate leverage for the unique volatility of a 78,000–80,000 bitcoin.
Conclusion: Turning Volatility Into A Laboratory
Bitcoin consolidating just below 80,000, with tightly aligned spot and futures markets and strong demand from funds and ETFs, represents a pivotal phase rather than a finished story.[3][5][11][12][14] Whether price cleanly breaks above resistance or spends more time ranging, this environment offers a rich “laboratory” for traders to study how markets behave around key psychological and technical levels.
By focusing on futures curves, positioning data, and clearly defined scenarios—and by making full use of simulated trading to refine execution and risk rules—traders can turn headline‑driven volatility into a structured learning opportunity rather than a source of emotional decision‑making. In a market as fast‑moving as crypto, skillfully navigating these inflection points often matters more than guessing the next 5,000 dollars on the chart.