
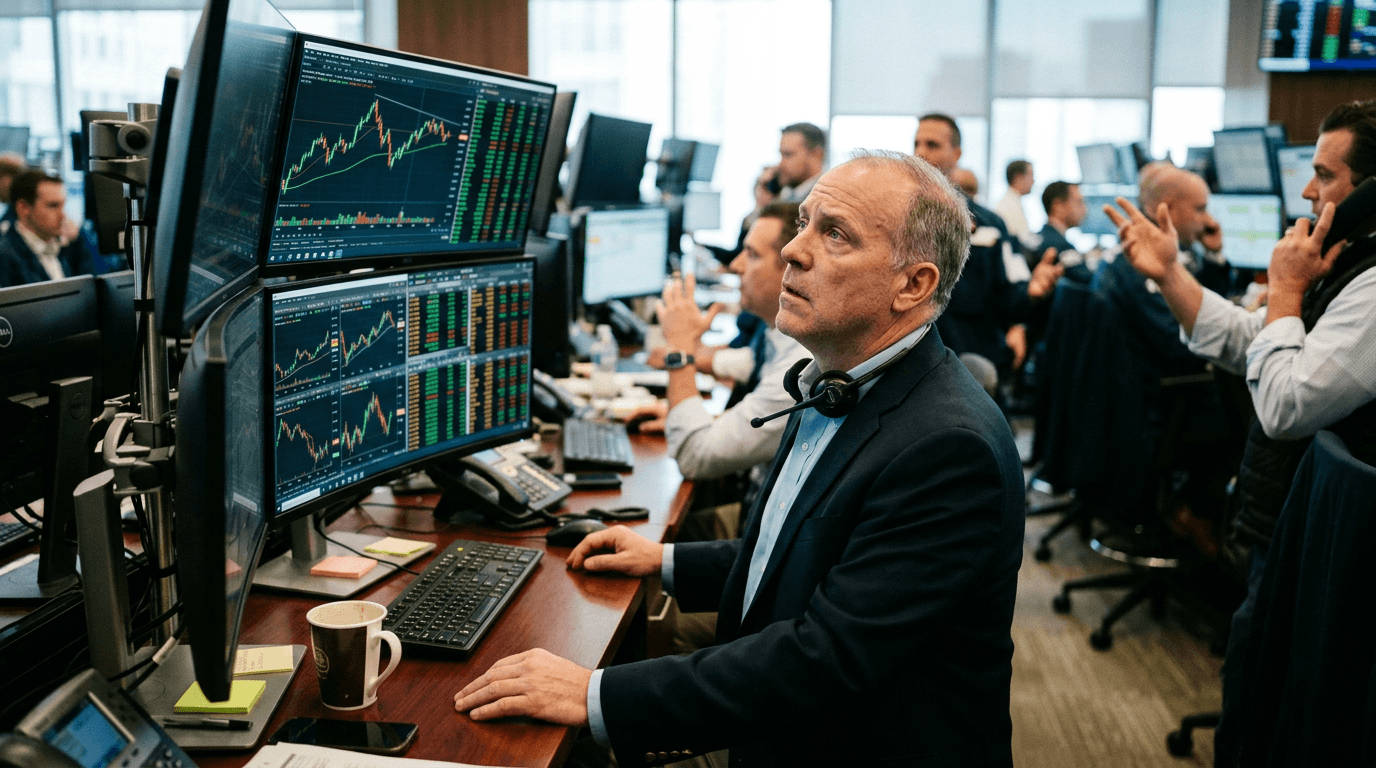
Bitcoin’s latest surge above $65,000 has put leverage and risk management back in the spotlight, as a powerful short squeeze forced bearish traders to exit losing positions at speed.[1][3] Data from derivatives trackers show around $56 million in short liquidations over a 24-hour window, versus only a small fraction of long positions closed, highlighting how one-sided positioning can suddenly flip into cascading losses.[1][3] For traders in both live and simulated markets, this move is a textbook case of how crowded trades, liquidity pockets, and futures mechanics can amplify price action well beyond what spot flows alone might suggest.[1][6]
CURRENT MOVE: BTC JUMPS ABOVE $65,000
Bitcoin’s move above the $65,000 mark comes after several weeks in which this level acted as both a psychological barrier and a technical resistance zone on major exchanges.[1][4][11] Recent market updates show that as price pushed through the ceiling, short positions clustered around that level began to unwind, triggering automated liquidations on leveraged accounts.[1][3][6] Derivatives data indicate that short liquidations have sharply outpaced long liquidations, underscoring how many traders were positioned for downside just as the market turned higher.[1][3][6] In previous episodes, similar squeezes have erased hundreds of millions of dollars in shorts in minutes; while this latest move is smaller in notional terms, it follows the same pattern of rapid reversal from oversold conditions.[5][10]
For spot traders, the price jump reopens a broader range between support near the low-$60,000s and resistance data pointing to upper bands in the high-$60,000s.[4][11] In practice, this means intraday volatility can remain elevated as both new longs and freshly trapped shorts attempt to rebalance around a key pivot zone.[1][4]
WHAT IS A SHORT SQUEEZE AND WHY DOES IT MATTER?
A short squeeze occurs when traders who have sold an asset short are forced to buy it back as the price climbs, either because their loss thresholds are hit or because margin requirements increase.[2][10] In crypto futures, this process is often automated: once margin falls below exchange requirements, positions are liquidated at market prices, pushing the asset higher and potentially triggering further liquidations.[2][10] When a large share of open interest is positioned on the short side, even a modest initial rally can set off a chain reaction of forced buying, creating an outsized move relative to the original catalyst.[10][12]
In the current BTC episode, roughly $56 million in shorts were wiped out around the move to $65,000, signaling that bearish conviction was high but poorly hedged.[1][3] This is consistent with recent patterns in crypto where derivatives activity has risen, with open interest surging by billions of dollars in short time frames as traders lean into directional bets.[14][15] When those bets cluster around obvious technical levels such as round numbers or prior highs, the setup for a squeeze becomes clearer: any breach can hit stop-loss orders, trigger liquidations, and create abrupt, liquidity-thin rallies.[6][8]
How Derivatives Turn Volatility Up
Bitcoin’s derivatives market now frequently sees single-day increases in open interest measured in tens of thousands of BTC, worth billions of dollars at current prices.[13][14][15] This concentration of leverage means that price moves are no longer driven solely by spot buying or selling, but also by the mechanical behavior of futures and perpetual swaps when funding rates, margin, and risk limits change.[12][14] When open interest is elevated and skewed toward shorts, a fast upward move can force traders to cover, compressing liquidity on the offer side and allowing price to jump through resistance with minimal actual net buying.[10][12]
Recent reports highlight that short liquidations near the mid-$60,000s have been hitting monthly highs, even on relatively modest percentage moves of around 3%–4% in BTC.[6][11] This tells traders that the real driver is not necessarily massive fresh demand, but rather the unwinding of leveraged positions that had been betting on further declines.[6][12] For risk managers, the takeaway is straightforward: leverage multiplies not just potential returns but also execution risk, especially around event-driven or technically significant levels.
In SimFi environments, these dynamics can be observed without capital at risk, making them ideal laboratories for understanding how futures curves, funding rates, and liquidation cascades translate into intraday price behavior. Simulated portfolios can be used to stress-test what happens when positions are too concentrated on one side of the market and how quickly a “small” move can become a multi-standard-deviation spike in P&L.
Lessons For Simulated Finance And Active Traders
The $65,000 short squeeze carries several practical lessons for traders using simulated platforms like E8 Markets as well as those trading live capital. First, avoid crowding one-way trades. When sentiment is heavily bearish and open interest tilts toward shorts, the risk of a sharp squeeze is high, particularly around clearly watched levels like $65,000 and prior local highs.[1][6][11] SimFi environments allow traders to map positioning and test scenarios where the market moves against consensus to gauge how their strategies hold up under stress.
Second, respect leverage. The liquidation data from BTC’s squeeze show that leveraged short positions were disproportionately impacted, even though the underlying price move was relatively contained in percentage terms.[1][3][6] In simulation, traders can experiment with different leverage levels and margin rules to understand how small changes in volatility can result in large swings in account equity. This can inform more conservative risk parameters when transitioning to real trading, such as lower maximum leverage, tighter per-trade risk limits, and predefined drawdown thresholds.
Third, combine technical levels with positioning data. Market updates around BTC emphasize the importance of price zones like $62,600 as support and $65,000–$66,000 as resistance in defining the path of short-term trends.[4][11] While simulated platforms may not provide full on-chain or derivatives positioning data, traders can incorporate public metrics—such as open interest, funding rates, and liquidation heatmaps—into their analysis to anticipate where squeezes or flushes are most likely.[6][12][14]
Finally, treat squeezes as learning opportunities rather than purely as missed trades. Reviewing how the market behaved before, during, and after the move can help refine entries, exits, and risk controls. This includes studying how quickly liquidation volumes rose, which exchanges saw the largest impact, and how spot and futures prices converged or diverged during the event.[1][6][10]
What To Watch Next
With Bitcoin back above $65,000, the key question is whether this move evolves into a sustained trend or remains a short-covering rally that fades as liquidity normalizes.[1][4][11] Analysts have flagged nearby resistance bands and cost bases for short-term holders in the high-$60,000s, suggesting that further upside may require either fresh spot demand or another wave of derivative-driven momentum.[4][11] At the same time, recent surges in futures open interest show that risk appetite remains high, increasing the likelihood of further volatility as macro data, regulatory headlines, and ETF flows shift positioning.[12][14][15]
For SimFi traders, the environment is ideal for sharpening skills: elevated volatility, clear technical levels, and visible leverage dynamics create rich scenarios for backtesting, forward-testing, and live simulation under realistic market stress. Using this squeeze as a case study, traders can build and refine playbooks that cover both trend-following and mean-reversion tactics, with a strong overlay of risk management focused on drawdowns, margin, and position sizing.
In the end, Bitcoin’s jump above $65,000 is less about celebrating a round number and more about understanding the engine behind the move. Short squeezes reveal where markets were overconfident, where risk controls failed, and where opportunity emerges for those prepared with robust frameworks. Whether in simulated or live environments, traders who treat these episodes as structured learning moments will be better positioned for the next wave of volatility—whatever direction it takes.