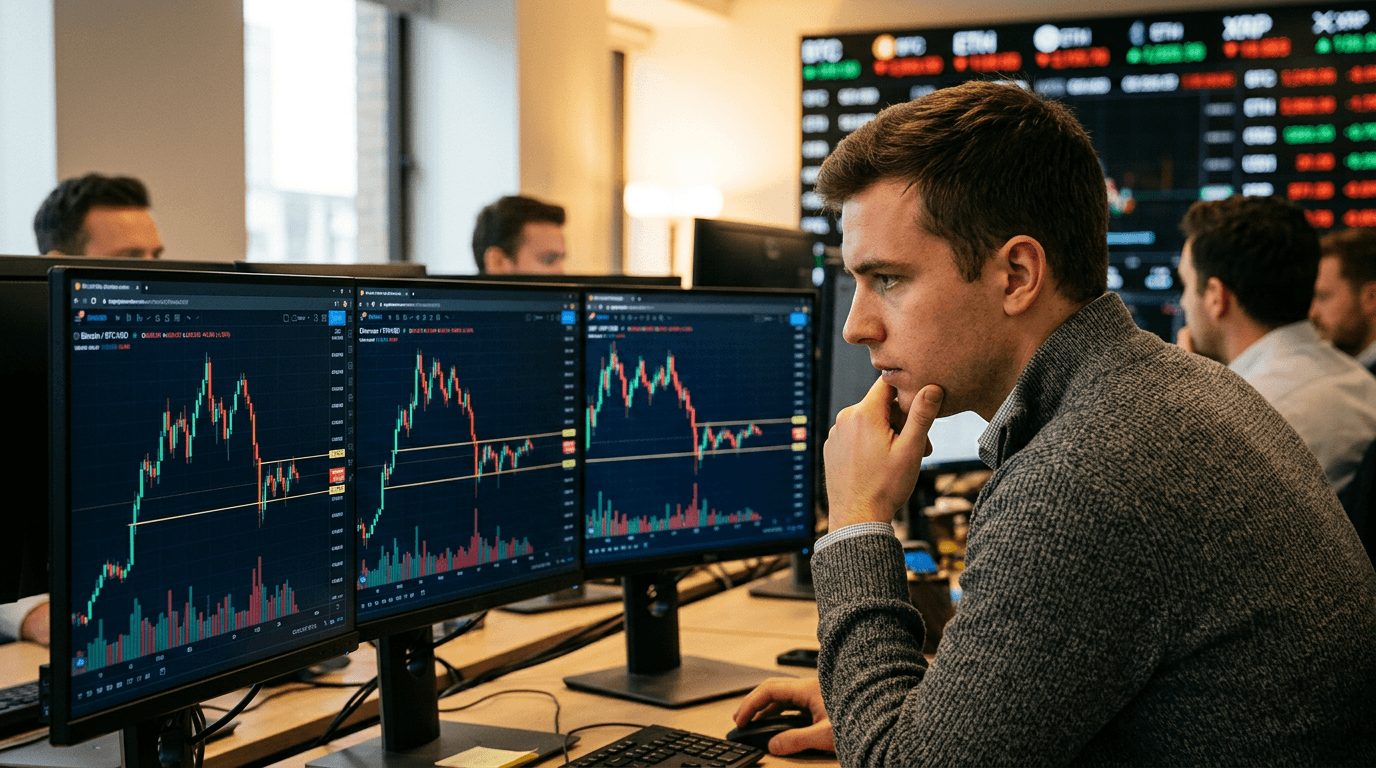
Major cryptocurrencies are catching their breath after a roughly 2% pullback, with Bitcoin holding above the 71,000 area, Ethereum hovering near 2,000, and XRP chopping sideways as traders rethink how much risk they really want to carry.[1][2] Rather than a dramatic risk-off event, the tape looks like a controlled pause at important support levels while the market digests recent gains, resets leverage, and waits for the next catalyst.[1][2]
Market Pause At Key Support
Periods like this are best understood as consolidation, not capitulation. In a consolidation, price tends to move sideways within a defined band rather than breaking to fresh highs or lows, as buyers and sellers rebalance positions.[2] Volatility usually cools, intraday ranges tighten, and the market shifts from trend-following to mean-reversion behavior.
What stands out in the latest move is what did not happen: there was no disorderly cascade of liquidations or sharp breaks below major support.[1] Selling pressure was enough to bleed off some speculative excess but not enough to flip the broader structure decisively bearish.[1] That balance is exactly what you would expect when traders are cautious but not panicked.
For Bitcoin, holding above the 71,000 region matters because this zone lines up with a previous consolidation band that has flipped from resistance into short‑term support.[1] Ethereum’s proximity to 2,000 is equally important, both as a psychological level and as an area that has repeatedly acted as a battleground between bulls and bears over the past year.[1][2] XRP, meanwhile, remains trapped in a tight range, with rallies capped but buyers still stepping in at layered supports beneath spot prices.[1]
From a sentiment perspective, this combination usually signals a “wait and see” market: participants are reluctant to chase new highs, but they are also not stampeding for the exits.[1]
Risk Appetite And The Macro Backdrop
The consolidation in crypto is not happening in isolation. The recent pullback and sideways action are unfolding against a backdrop of shifting expectations around inflation, interest rates, and central bank policy.[2] As investors reassess how stubborn inflation might be and how policymakers could respond, risk appetite across assets has become more selective and cautious.[2]
This recalibration has been visible not just in spot coins but also in crypto‑linked futures and high‑beta tech stocks, which have come under pressure during the intraday session.[1][2] When markets become more sensitive to macro headlines, assets with higher volatility and leverage embedded in their structure tend to feel it first.
Derivatives positioning has been quietly but meaningfully reshaped as well. Leverage in perpetual swaps and futures has been trimmed as traders de‑risk, cutting back on aggressive long exposure and allowing some of the froth to come out of the system.[1] That reset has two important implications:
First, it reduces the risk of a sudden liquidation cascade if prices test support again, because there is less crowded leverage that can be forcibly unwound.[1] Second, it sets the stage for cleaner signals: once positioning is less stretched, the next directional move is more likely to be driven by fresh flows rather than forced deleveraging.
In other words, the market is less fragile than it was a few sessions ago, even if sentiment feels a bit more nervous.
Key Levels To Watch: Bitcoin, Ethereum, Xrp
For short‑term traders, the current environment is defined by a handful of key reference points.
Bitcoin’s 71,000 area has emerged as a short‑term “line in the sand,” sitting inside a broader 60,000–74,000 consolidation range that has contained price action in recent weeks.[1][2] Within that wider band, 71,000 functions as an internal pivot: a hold opens the door to another test of the upper range, while a decisive loss raises the odds of a rotation back toward the lower boundary.[2]
Ethereum near 2,000 carries similar weight. This round number has repeatedly served as both support and resistance, making it a natural level for traders to anchor their risk.[1][2] A sustained hold above 2,000 suggests that dip‑buyers are still willing to defend the trend; a break and daily close well below it would be a warning that the balance of power is shifting.
XRP continues to move sideways in a relatively tight band, repeatedly rejecting attempts to push higher but also finding demand at clustered supports below spot.[1] For range‑focused traders, this kind of structure offers both opportunity and risk: it can reward disciplined mean‑reversion strategies, but it also punishes late entries and emotional chasing when the range eventually resolves.
In practice, intraday traders in futures and perpetual swaps are likely to key off how price behaves around 71,000 for BTC and 2,000 for ETH, using funding rates, basis, and liquidation data as secondary confirmation tools.[1] Strong bounces from these levels with improving derivatives sentiment would carry more weight than blind dip‑buying just because “it’s support.”[1]
Trading Playbook For A Consolidating Market
When the market is digesting a pullback at support, edge comes less from bold predictions and more from process. Several practical principles stand out.[1][2]
First, define clear invalidation. Instead of treating support as a vague zone, specify what would prove your idea wrong—such as a daily close well below support on rising volume or a pattern of lower highs and lower lows forming beneath it.[1] This keeps your risk defined even when price is noisy.
Second, size positions for volatility. Trading around important levels often includes whipsaws: brief dips below support that snap back, or sharp spikes higher that quickly fade.[1] Using smaller position sizes relative to your capital gives you room to tolerate that noise, scale in more deliberately, or pivot quickly if the market moves against you.
Third, wait for confirmation when possible. Entering purely on the assumption that “support will hold” can be costly.[1] Many traders prefer to see evidence of buyers stepping in: a forceful bounce off support with expanding volume, a reclaimed level after a brief breakdown, or momentum indicators turning up from oversold readings.
Fourth, match your time frame to your strategy. Scalpers may focus on how Bitcoin trades tick‑by‑tick around 71,000 or how Ethereum reacts to 2,000 on lower‑time‑frame charts, while swing traders care far more about daily and weekly closes.[1][2] Longer‑term investors, meanwhile, are focused on whether the broader uptrend and higher‑time‑frame structure remain intact despite short‑term chop.
Finally, tighten risk management across the board. Consolidation phases are notorious for false breakouts and sudden reversals.[2] Smaller position sizes, well‑placed stops, and disciplined profit‑taking can help you stay in the game long enough to participate when a genuine trend leg eventually emerges.
Using Simulated Trading To Refine Execution
Choppy, range‑bound conditions are an ideal environment to sharpen execution without taking unnecessary real‑world hits. Simulated finance (SimFi) platforms such as E8 Markets let traders practice trading ranges, mean‑reversion setups, and breakout strategies against realistic market data but without putting live capital on the line.[2]
This is particularly valuable when markets are hovering near key supports and reacting to headlines. You can test how different stop distances perform around noisy levels, experiment with staggered take‑profit orders near resistance, and compare the outcomes of aggressive versus conservative entries.[2] Over a series of simulated trades, even small refinements to timing and risk per trade can compound into a meaningful performance difference.
Because no one knows with certainty whether Bitcoin will hold 71,000 this time or whether Ethereum will maintain 2,000, the most controllable variable is your process: how you define risk, how you execute, and how you respond when the market surprises you.[1][2] Simulation offers a structured way to iterate on that process before scaling it in live conditions.
Conclusion
Bitcoin, Ethereum, and XRP stabilizing above key supports after a modest 2% pullback is less a reason for alarm and more a reminder that strong trends rarely move in straight lines.[1][2] Support zones are doing their job so far, leverage has cooled, and the market is clearly in reassessment mode rather than outright liquidation.
From here, the next meaningful move will likely be shaped by how these support levels behave as macro headlines and data continue to influence risk appetite.[1][2] For traders, the opportunity lies in treating the current consolidation as a decision zone: map out scenarios for both a hold and a break, align your strategy with your time frame, and let price action—not emotions—confirm which path the market ultimately chooses.