
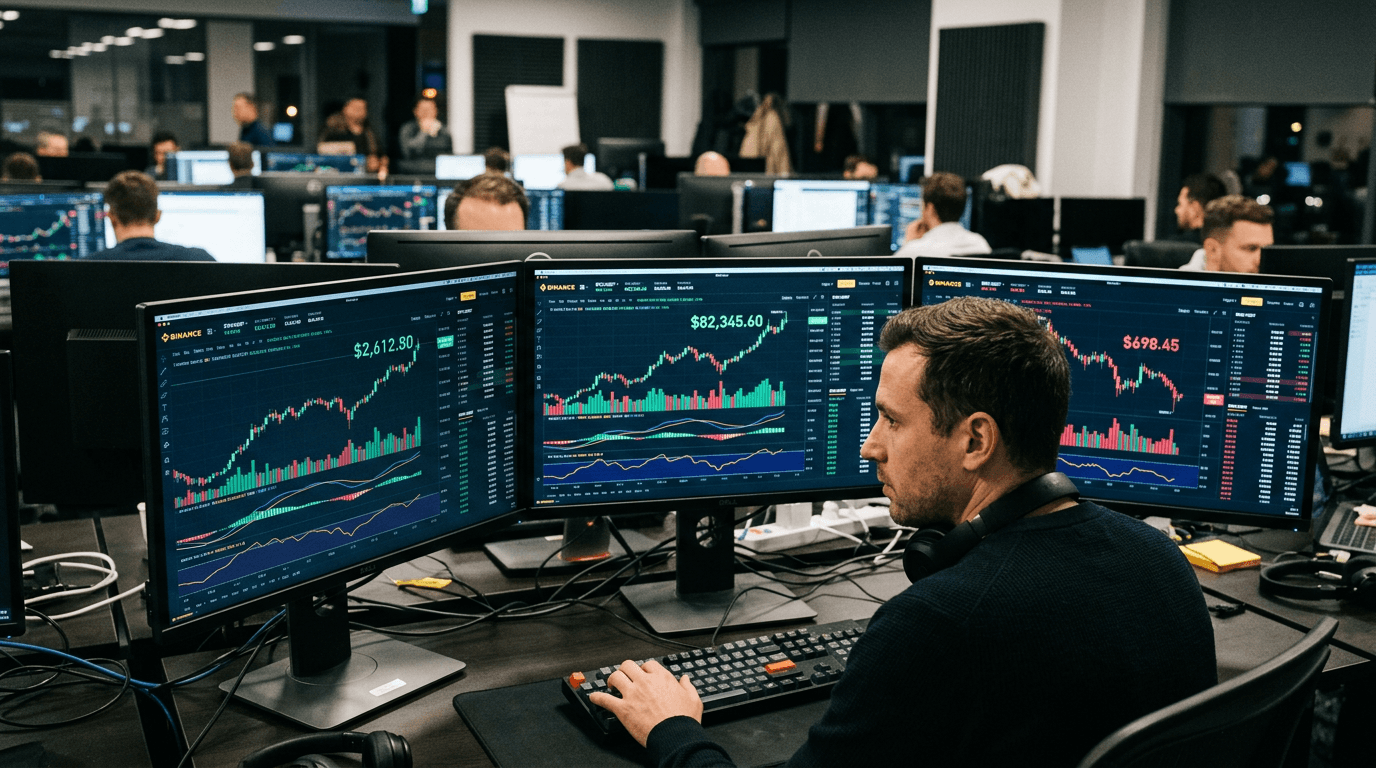
Round numbers have a way of concentrating attention in financial markets, and the latest Binance data for BNB, Bitcoin and Ethereum shows exactly that dynamic at work. Bitcoin has pushed above the 80,000 USDT mark, Ethereum is trading above 2,500 USDT, while BNB has slipped back below 750 USDT, creating a cluster of key psychological levels across three of the most important crypto assets[2][6][8][13][15]. For traders, these are not just arbitrary milestones; they are areas where positioning, sentiment and risk management tend to shift quickly.
Psychological Levels In Crypto Trading
In liquid markets, round numbers such as 80,000, 2,500 or 750 often act as “mental support and resistance” because they are easy reference points for both retail and institutional participants. That simplicity leads to concentrated order flow: stop-loss orders, take-profit targets and breakout entries frequently gather around these levels, which can amplify short-term volatility when price approaches or crosses them[1][7][10][13].
On Binance and other major exchanges, order book data typically reveals thicker liquidity bands around these round numbers, reflecting how market makers and algorithmic strategies use them to manage inventory and hedge exposures[2][10]. In practice, this means traders should expect more whipsaws, failed breaks and rapid follow-through moves when price interacts with a widely watched psychological threshold.
For SimFi users on platforms like E8 Markets, these zones offer an ideal training ground to observe order reactions in real time without capital at risk. Simulated strategies can be stress-tested around round-number levels to see how entries, exits and position sizing hold up when markets accelerate or stall near major thresholds.
Bitcoin Above 80,000: What It Signals
Bitcoin’s move back above 80,000 USDT on major venues marks a significant recovery from earlier drawdowns and has reignited bullish sentiment across the crypto complex[6][9][15]. Recent reports note that BTC has climbed as high as the low 80,000s, representing gains of more than 20–25% over short time windows and forcing liquidations in crowded leveraged short positions[6][15]. When a market leader like Bitcoin clears such a well-publicized level, it often triggers momentum inflows from trend-following traders and systematic funds.
From a technical perspective, analysts are watching how Bitcoin behaves relative to its higher-timeframe moving averages, including the 50-week average near the low 80,000s, to judge whether the breakout has sustainable “legs”[15]. Sustained closes above both the psychological barrier and these structural reference points typically strengthen the case for a continued uptrend, while repeated failures or sharp reversals hint at distribution rather than genuine trend extension.
Practically, traders can use 80,000 as a pivot: above it, they might favor trend-continuation setups with tight trailing stops; below it, they can frame mean-reversion trades or hedge exposure into potential pullbacks. SimFi environments allow participants to simulate scenarios such as “fake-out above 80k” versus “clean breakout and retest,” helping refine reaction plans before committing real capital.
Ethereum Around 2,500: Gateway Level For Altcoins
Ethereum’s position above the 2,500 USDT level is another important signal for the broader market, given its role as infrastructure for DeFi, NFTs and many altcoin ecosystems[8][13]. Recent technical analyses highlight the 2,350–2,500 zone as a strong resistance band, with 2,500 acting as the key psychological threshold reinforcing nearby Fibonacci and moving average levels[8][13]. A decisive break and hold above this area often aligns with improved risk appetite across altcoins and Layer-2 tokens.
Current price action shows ETH consolidating not far above major EMAs, suggesting that buyers have regained some control but are still testing the durability of the move[8]. This kind of consolidation just above a round number frequently becomes a staging ground: either the market builds energy for a push toward higher resistance zones (for example, near 3,000 on some analyses) or it rolls over, trapping late longs and returning to prior ranges[8][13].
For traders, ETH at or above 2,500 offers a reference for relative strength versus Bitcoin and major altcoins. Strategies like pair trading (e.g., ETH/BTC or ETH/BNB) can be framed around whether Ethereum is outperforming or lagging during tests of this level. In a SimFi setting, experimenting with different ETH allocation rules when price is above, at, or below 2,500 helps clarify how portfolio risk changes as the market shifts between cautious and risk-on modes.
Bnb Below 750: Exchange Token Sentiment Check
BNB’s slip below 750 USDT in the last 24 hours is notable because the 700–750 band has acted as a critical demand and consolidation area on Binance data[2][10][12]. Prior analyses identified 730–750 as both a resistance and later a “retest support” zone, with significant historical volume concentrated there, effectively making it a structural floor for bullish scenarios in BNB/USDT[1][3][10][12]. When price falls back under the upper edge of such a zone, it often triggers reassessment among holders regarding short-term risk.
Exchange tokens like BNB tend to reflect the health of their ecosystems; elevated activity in BNB Chain DeFi, DEX volumes and active addresses has previously coincided with strength in BNB around and above 750[11]. A dip below that level therefore raises questions about whether this is a routine pullback in an established uptrend or the start of a deeper rotation away from exchange-linked exposure[2][10].
From a trading perspective, 700–750 can be used as a structured decision band. Above 750, the bias leans toward continuation and upside probes into higher resistance zones; between 700 and 750, traders may frame range trades and liquidity sweeps; below 700, they might prepare for scenarios where bulls lose the benefit of doubt and larger corrections unfold[1][10]. SimFi platforms allow users to map different stop-loss and take-profit rules across these segments, testing how P&L evolves as BNB oscillates around such dense liquidity areas.
Practical Takeaways For Simulated And Live Traders
The simultaneous clustering of psychological levels in Bitcoin, Ethereum and BNB creates a unique environment for both education and opportunity. Bitcoin above 80,000, Ethereum around 2,500 and BNB near but below 750 mean three major assets are sitting at or near widely watched thresholds, concentrating liquidity, sentiment and narrative into a narrow band of prices[2][6][8][10][15]. This alignment increases the likelihood of sector-wide moves if any of these levels break decisively or fail dramatically.
For short-term traders, the key is to avoid treating round numbers as magic lines and instead see them as risk zones. That means defining clear rules: how much size to deploy on first touch, how to respond to false breaks, and when to scale out if volatility spikes on either side of a level. Backtesting and simulation can reveal whether a strategy tends to overreact to initial touches or underreact to confirmed breaks, allowing fine-tuning before live deployment.
Longer-term investors can use psychological levels as communication tools rather than trading signals. Explaining allocation changes in terms of well-known thresholds (for example, “reducing BTC exposure if it fails to hold above 80,000 for several weeks”) makes portfolio decisions more transparent and easier to review. SimFi accounts at platforms like E8 Markets provide a controlled environment to rehearse these policies, logging decisions and outcomes without the emotional pressure of real gains or losses.
Conclusion: Navigating Round Numbers With Discipline
The current situation—Bitcoin above 80,000, Ethereum above 2,500 and BNB dipping below 750—captures how round numbers can shape short-term crypto sentiment and positioning on a major exchange like Binance[2][6][8][10][15]. These levels will likely act as pivot points for trend traders, mean reversion specialists and risk managers over the coming sessions.
Whether trading in a simulated environment or live markets, the lesson is consistent: psychological levels deserve respect, but not reverence. They are powerful because many participants focus on them, not because they guarantee any particular outcome. Treat them as high-information zones where discipline, preparation and risk management matter most, and they become tools that enhance decision-making rather than traps that exploit emotional reactions.