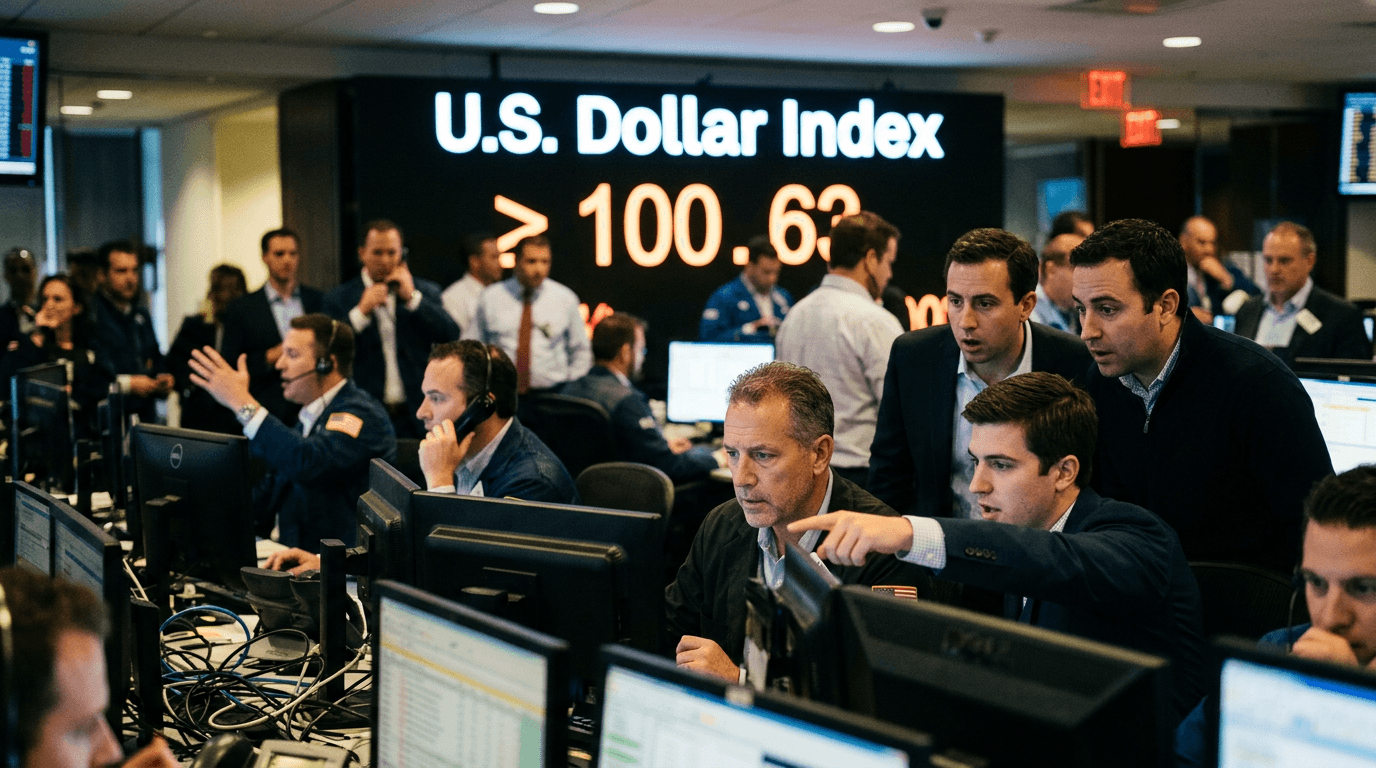
The U.S. Dollar Index has broken below the psychologically important 100 level for the first time since mid‑2023, underscoring a rapid shift in market expectations toward more aggressive Federal Reserve rate cuts.[3][6] The slide began with a gap lower in Asian trade, extending a multi‑day selloff that has driven broad dollar weakness and fueled gains in risk‑sensitive currencies such as the Australian dollar and many emerging‑market units.[2][6] For traders, this is not just a technical milestone but a macro turning point that can reshape trends across FX, equities, and commodities.
What The Dollar Index Actually Measures
Before trading the move, it is crucial to understand what the U.S. Dollar Index (often quoted as DXY) represents.[1] The index tracks the value of the dollar against a basket of six major currencies: the euro, Japanese yen, British pound, Canadian dollar, Swedish krona, and Swiss franc, with the euro carrying by far the largest weight.[1][3] That means a big move in EUR/USD can disproportionately drive the index, even if other pairs are relatively quiet.[1]
The index was created in 1973 with a base value of 100, set after the collapse of the Bretton Woods system.[3] A reading above 100 means the dollar is stronger than it was at that 1973 benchmark; a reading below 100 means it is weaker.[3] That base level has taken on symbolic importance over time: when the index is near 100, many traders treat it as a “line in the sand” between strong and weak dollar regimes.
From a trading perspective, the Dollar Index is not just a chart; it is a summary of global risk sentiment, relative growth expectations, and yield differentials between the United States and its major trading partners.[1][3] Moves through big round numbers like 100 often coincide with shifts in macro narratives, portfolio flows, and hedging behavior.
Why Rate-cut Bets Are Hitting The Dollar
The latest leg lower in the dollar is being driven primarily by a repricing of Federal Reserve policy.[2][6] As inflation data has cooled from its peaks and signs of slower growth have emerged, markets have increased their bets that the Fed will cut rates sooner and more aggressively than previously expected. Rate futures now embed a lower path for the federal funds rate over the coming year, compressing the yield advantage that supported the dollar during the Fed’s tightening cycle.
When U.S. interest rates are expected to fall relative to those in Europe, Japan, or other developed markets, the dollar typically loses some of its appeal as a high‑yielding safe haven.[3] International investors who previously parked capital in U.S. Treasuries for attractive yields may start to seek alternatives, while carry traders look to fund positions in lower‑yielding currencies and buy higher‑yielding ones. That dynamic encourages selling of dollars and buying of currencies that stand to benefit from the new rate environment.
The market’s move has been amplified by positioning. Throughout the prior period of Fed tightening, many macro and systematic strategies were structurally long the dollar, especially against low‑yielders like the yen.[3] As expectations flipped toward easing, those positions became vulnerable, triggering stop‑loss cascades and forced de‑leveraging as the Dollar Index headed toward 100 and then broke beneath it.[6]
Winners, Losers, And Cross-asset Ripple Effects
The immediate winners from a weaker Dollar Index are the major currencies in the basket itself. A decline in the index often corresponds to a higher EUR/USD, GBP/USD, and AUD/USD, assuming other factors remain constant.[1][3] Risk‑sensitive currencies—including the Australian and New Zealand dollars and many emerging‑market currencies—tend to outperform when the dollar is under pressure and rate‑cut hopes support global growth sentiment.[6]
Commodities are another key channel. Because many commodities, including oil and gold, are priced in dollars, a weaker USD often makes them cheaper in local‑currency terms for non‑U.S. buyers, supporting demand.[3] Historically, strong commodity upswings have frequently coincided with periods of dollar weakness, particularly when driven by easier U.S. monetary policy and stronger global growth.
On the other side of the trade, dollar‑bullish strategies are feeling the pain. U.S. importers that benefited from a strong dollar now face a less favorable currency backdrop, while non‑U.S. borrowers with dollar‑denominated debt may enjoy some relief as their local currencies strengthen.[3] For global equity markets, dollar weakness tends to be a tailwind: U.S. multinationals benefit from more competitive exports and better translation of foreign earnings, while emerging‑market equities often see improved capital inflows when dollar funding looks less restrictive.[6]
Trading Implications For Fx And Simulated Finance Traders
For active traders and SimFi participants, the break below 100 is a signal to reassess both macro assumptions and risk management. In simulated environments that mirror real‑world pricing, a regime shift in the Dollar Index can increase volatility across a wide set of instruments, from major FX pairs to stock indices and metals.[2][5] This environment rewards traders who can link macro narratives to price action rather than trading levels in isolation.
Several practical guidelines stand out
First, respect the psychological and technical importance of the 100 level. Once a widely watched level breaks, markets often test how far the new narrative can run, triggering overshoots before any consolidation. Traders should be cautious about blindly fading the move without evidence that rate‑cut expectations have gone too far.
Second, focus on relative central bank paths, not just the Fed in isolation. The impact on EUR/USD, GBP/USD, or USD/JPY will depend on whether the European Central Bank, Bank of England, and Bank of Japan are seen as more or less dovish than the Fed.[3] A Fed easing cycle that is matched or exceeded by other central banks may not deliver the same degree of dollar weakness as a unilateral U.S. pivot.
Third, risk management becomes even more critical during macro‑driven repricings. Gaps in Asian trade, intraday reversals around headlines, and sharp swings around key economic releases are common when markets are recalibrating to a new policy trajectory.[2] Simulated accounts are ideal for stress‑testing position sizing, stop‑loss placement, and diversification strategies before deploying them with real capital.
Key Levels, Catalysts, And Scenarios To Watch
Looking ahead, traders should map out clear scenarios rather than anchoring on a single view. One scenario is a continued grind lower in the Dollar Index if incoming data validates the market’s expectations for multiple Fed cuts and other central banks stay comparatively restrictive.[3] In that case, risk‑sensitive currencies, emerging markets, and commodities could remain supported, with dollar rallies being sold.
An alternative scenario is a “hawkish pushback” from the Fed. If policymakers signal discomfort with how aggressively markets are pricing cuts—or if inflation data re‑accelerates—the front end of the U.S. yield curve could move higher, prompting a sharp short squeeze in the dollar.[3] That would likely drive a rebound above 100 and force rapid positioning adjustments.
In both scenarios, key catalysts include U.S. inflation prints, labor market data, FOMC meetings and minutes, and speeches from Fed officials. Traders should also monitor yield spreads between U.S. Treasuries and major foreign government bonds, as shifts in these differentials are a core driver of currency moves.[3] Technical levels around the recent lows below 100, as well as prior consolidation zones from mid‑2023, can provide additional reference points for entries, exits, and risk limits.
For now, the drop below 100 is a clear marker that the “strong dollar on higher-for-longer rates” regime is being challenged. Whether it evolves into a sustained weak‑dollar cycle or a temporary shakeout will depend on how the Fed’s actions ultimately line up with the market’s increasingly confident rate‑cut bets.