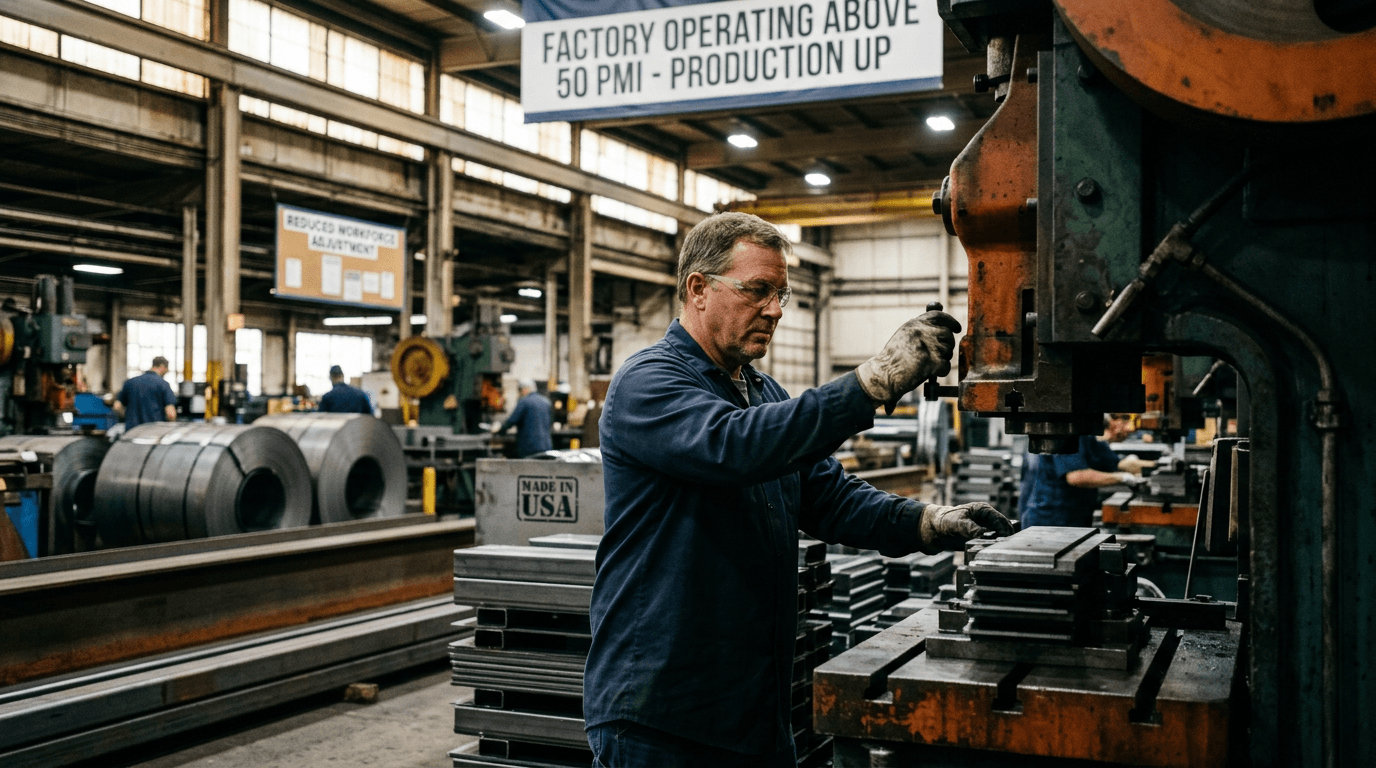
US manufacturing is sending a confusing message again: survey data say factories are picking up, but payroll announcements point to more layoffs. The latest manufacturing PMI jumped back above 50 to roughly 52, signaling expansion, even as reports of factory job cuts increased. For traders, this isn’t just a quirky data point — it reshapes expectations around interest rates, earnings, and sector performance.
Mixed Signals From The Factory Floor
On one side of the story, the manufacturing PMI has moved back into expansion territory after a long stretch below 50, indicating that overall activity in the sector is growing again.[4][8] A reading above 50 means more purchasing managers are seeing rising output, new orders, and production compared with the previous month.[4][7][9] In some recent reports, the index has climbed into the low 50s after spending months in the high 40s, marking the first sustained uptick in activity in over a year.[1][3]
On the other side, factory employment headlines are going the other way. Layoff announcements and hiring freezes suggest manufacturers are still cautious about committing to long-term labor costs, even as orders improve. That tension — stronger top-line activity but weaker jobs — is exactly what makes this data mix so important for macro-focused traders.
The key question is whether this divergence reflects a temporary lag between demand and hiring, or a deeper structural shift toward leaner, more automated production that permanently breaks the old link between factory output and factory employment.
What A Pmi Above 50 Really Tells Us
To interpret this properly, you need to understand what a PMI actually measures. The manufacturing PMI is a survey-based index built from questions to purchasing managers about new orders, production, employment, supplier delivery times, and inventories.[2][5][7] Each component is turned into a diffusion index where 50 is the neutral line. Above 50 means more respondents report improvement than deterioration; below 50 means more see deterioration.[4][7][8]
Several features matter for trading
- It is a leading indicator. PMI often turns before hard data like industrial production or GDP because purchasing managers respond quickly to incoming orders and demand expectations.[2][9]
- A move from sub-50 to above 50 is especially meaningful. It signals a regime shift from contraction to expansion rather than just “less bad” contraction.[1][3][4]
- The subcomponents matter as much as the headline. Strong gains in new orders and production with weak employment can signal efficiency gains, automation, or management caution about long-term costs.[3]
In this case, the headline PMI moving above 50 suggests manufacturers are seeing better demand and are ramping production, even if they are doing it with fewer workers for now.
Why Manufacturers Are Cutting Jobs Into A Recovery
At first glance, rising job cuts during an activity rebound looks contradictory. In practice, several forces can make this entirely rational from the perspective of manufacturers:
- Productivity and automation: After a long period of weak conditions, firms that invested in technology, robotics, and process improvements can produce more with fewer workers. That allows output to rise and PMI to improve, even as headcount falls.
- Margin protection: Higher rates and tight financial conditions have raised the cost of capital. Companies may prioritize profitability and cash flow over growth, cutting labor costs while still fulfilling demand through overtime, automation, or outsourcing.
- Late-cycle behavior: Near a potential turning point in the cycle, managers are often unsure how durable new orders will be. They may be willing to increase production by drawing down inventories or boosting capacity utilization before committing to new hires.
- Sector rotation within manufacturing: Not all industries within manufacturing are moving in the same direction. High-tech, industrial machinery, and defense-related segments may be expanding, while more labor-intensive areas (like some consumer goods) still cut staff.
So the combination of stronger PMI and rising layoffs is not necessarily a contradiction. It may describe a transition toward a leaner manufacturing sector that can respond to demand without rehiring at previous levels.
Implications For Rates, Equities, And Futures Traders
This kind of divergence feeds directly into rate expectations. A stronger PMI suggests the growth picture is improving and that the economy may be more resilient than previously thought, nudging traders to price in fewer or slower rate cuts by the Federal Reserve.[2][8][9] At the same time, softer manufacturing employment tempers inflation fears by hinting that wage pressures in the industrial sector may remain contained.
For equities, the market reaction often shows up as sector rotation rather than a broad index move:
- Cyclical industrials, machinery, transportation, and some materials names can benefit from improving manufacturing demand.
- Labor-intensive manufacturers or firms exposed to squeezed margins (for example, those with less pricing power) may lag if investors worry the job cuts signal structural challenges.
- Growth and rate-sensitive sectors (like tech) might pause or pull back if stronger PMI data pushes yields higher and delays easing expectations.
In futures markets, traders react on multiple fronts:
- Treasury futures: Stronger PMI readings often trigger selling in longer-dated bonds as traders price in stronger growth and less urgency for rate cuts, pushing yields higher.
- Equity index futures: Reactions can be choppy, with intraday swings as algorithms digest the headline PMI, the subcomponents, and labor-market headlines simultaneously.
- Commodity futures: A manufacturing rebound is supportive for industrial commodities (like copper) and energy demand expectations, though this is moderated if job cuts imply efficiency gains rather than a broad surge in output.
How To Trade Mixed Macro Signals In A Simulated Environment
For traders using simulated environments, mixed data like this is a valuable training ground. It forces you away from simple “good number = buy” logic and into a more nuanced, multi-factor framework.
A few practical approaches
- Build scenarios, not forecasts: Instead of deciding whether the economy is “strong” or “weak,” map out scenarios. For example: “PMI stays above 50 and employment stabilizes” versus “PMI slips back below 50 while layoffs continue.” Plan how rates, sectors, and volatility might behave in each.
- Watch the spread between indicators: Track manufacturing PMI, manufacturing payrolls, and jobless claims together. A widening gap between activity and employment may favor trades that are long productivity winners (automation, industrial tech) and cautious on labor-heavy manufacturers.
- Focus on the reaction, not just the data: Often the most tradeable edge comes from how markets react versus what was priced in before the release. Use simulated trading to practice comparing the data to consensus and watching the first 30–60 minutes of price action.
- Respect the macro trend: One data release rarely reverses a macro trend. If the broader series of PMIs has been trending higher and other indicators (like services activity and consumer demand) are firm, treat labor softness as a nuance, not a full trend break — unless subsequent data confirm it.
In a SimFi setting, this is exactly the kind of environment where traders can test macro strategies, intraday reaction trades, and sector rotation ideas without real capital at risk. The goal is not to “get the number right,” but to build a repeatable process for interpreting conflicted information and translating it into risk-managed positions.