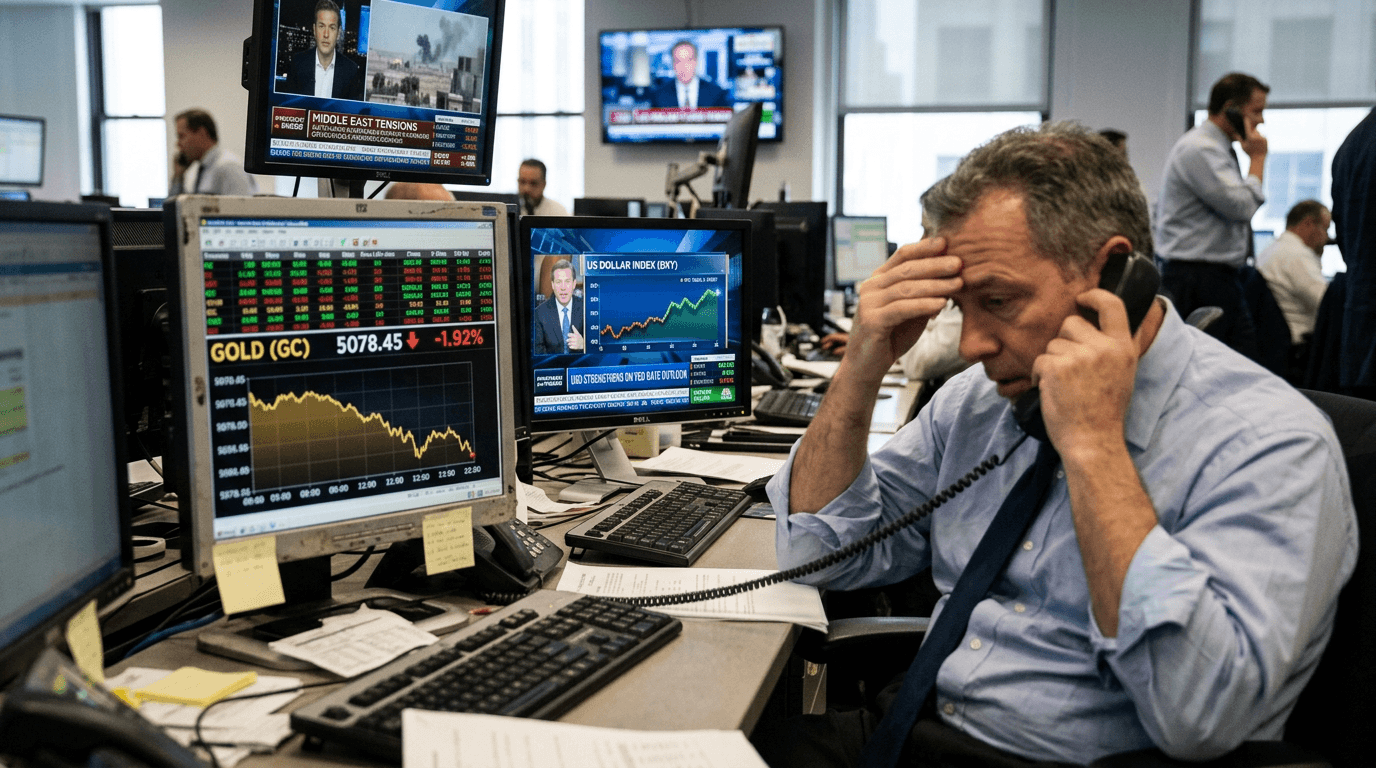
Gold prices settled at 5078.45 this week, marking a 1.92% decline as competing forces in the market created significant uncertainty around the precious metal's near-term direction. The move represents a crucial test of market sentiment, with investors caught between the protective appeal of gold amid geopolitical tensions and the reality of shifting monetary policy expectations that are weighing heavily on the yellow metal's performance.
The Currency Headwind
The primary culprit behind gold's recent weakness is a strengthening U.S. dollar that has overshadowed traditional safe-haven demand.[1] Gold is priced in dollars, making currency strength inherently challenging for the commodity. As the Federal Reserve's rate cut expectations have shifted downward—dropping from approximately 66 basis points in rate cuts to just 24 basis points—the dollar has naturally strengthened in response.[1] This dynamic creates a self-reinforcing negative loop for gold: higher real interest rates from fewer rate cuts make holding non-yielding assets like gold less attractive to investors, while simultaneously making dollar-denominated assets more appealing from a currency perspective.
The Iran Conflict Paradox
Perhaps the most surprising aspect of gold's recent price action is how quickly the initial safe-haven rally evaporated. When tensions escalated in the Middle East and the Strait of Hormuz faced potential closure, gold initially spiked from 5296 to 5423, a sharp move that seemed to confirm gold's role as a crisis hedge.[6] However, this rally proved unsustainable. The subsequent 6% reversal from the intraday high represents what many analysts describe as position flushing by paper traders rather than a fundamental reassessment of gold's value.[6] The closure of the Strait would normally sustain elevated oil prices and inflation concerns, both factors that should support gold prices. Instead, institutional investors took profits after the initial spike, suggesting that short-term trading activity overwhelmed fundamental considerations.
Technical Deterioration And The Death Cross
From a technical perspective, gold's chart has turned decidedly bearish. The precious metal is forming a "Death Cross," with the 50-day simple moving average (5,139) trending sharply toward the 100-day SMA (5,158), a historically negative signal for medium-term momentum.[1] Price is currently pinned below both moving averages, confirming a shift from bullish to bearish short-term conditions. Gold is trading within a defined horizontal range between 5,050 and 5,200, with the recent break below suggesting increasing selling pressure.[1]
The psychological $5,000 level has emerged as the critical line in the sand. As long as gold maintains a hold above this support, the current weakness can be characterized as a correction within a broader bull market.[6] A decisive four-hour close below 5,000, however, could trigger a deeper liquidation toward the 4,840 zone.[1] Conversely, buyers need a clean breakout above 5,200 to reclaim the bullish trend and reinvigorate momentum.
The Fomc Wildcard
Next week's Federal Reserve meeting represents a pivotal moment for gold's direction. Fed policymakers have been in a blackout period and have not yet publicly addressed the implications of the Iran conflict for inflation and monetary policy.[1] Market participants are particularly concerned that the December forecasts, which penciled in one rate cut for 2026, could be pushed back to 2027 given current geopolitical uncertainties and elevated oil prices.[1] Such a shift would further strengthen the dollar and weigh on gold prices in the near term. The new projections from Fed officials could either validate current pessimism or provide some relief by acknowledging the temporary nature of geopolitical premiums.
Fundamental Case Remains Intact
Despite the technical weakness and near-term headwinds, the fundamental case for higher gold prices has not deteriorated. Central banks continue their accumulation programs, U.S. fiscal deficits show no signs of shrinking, and the long-term dollar outlook remains soft.[6] Major investment banks maintain bullish targets: JPMorgan forecasts gold reaching 6,300 by year-end 2026, while Deutsche Bank and UBS target 6,000 and 6,200 respectively, with their projections set before the Iran escalation even occurred.[4][6] Gold has surged 68% year-over-year and ran from 2,600 to over 5,000 in just twelve months.[2][6] The structural factors that drove this remarkable rally remain in place.
Key Takeaways
Gold's 1.92% decline to 5078.45 reflects short-term trading dynamics and currency strength rather than a fundamental deterioration in the precious metal's long-term prospects. The $5,000 level is the critical support zone to monitor, with a breakdown signaling more severe weakness. The upcoming FOMC meeting will likely dictate gold's direction for the remainder of March and beyond. Patient investors should recognize this as a correction within an intact bull market, while traders should remain attentive to technical levels and Fed communications.