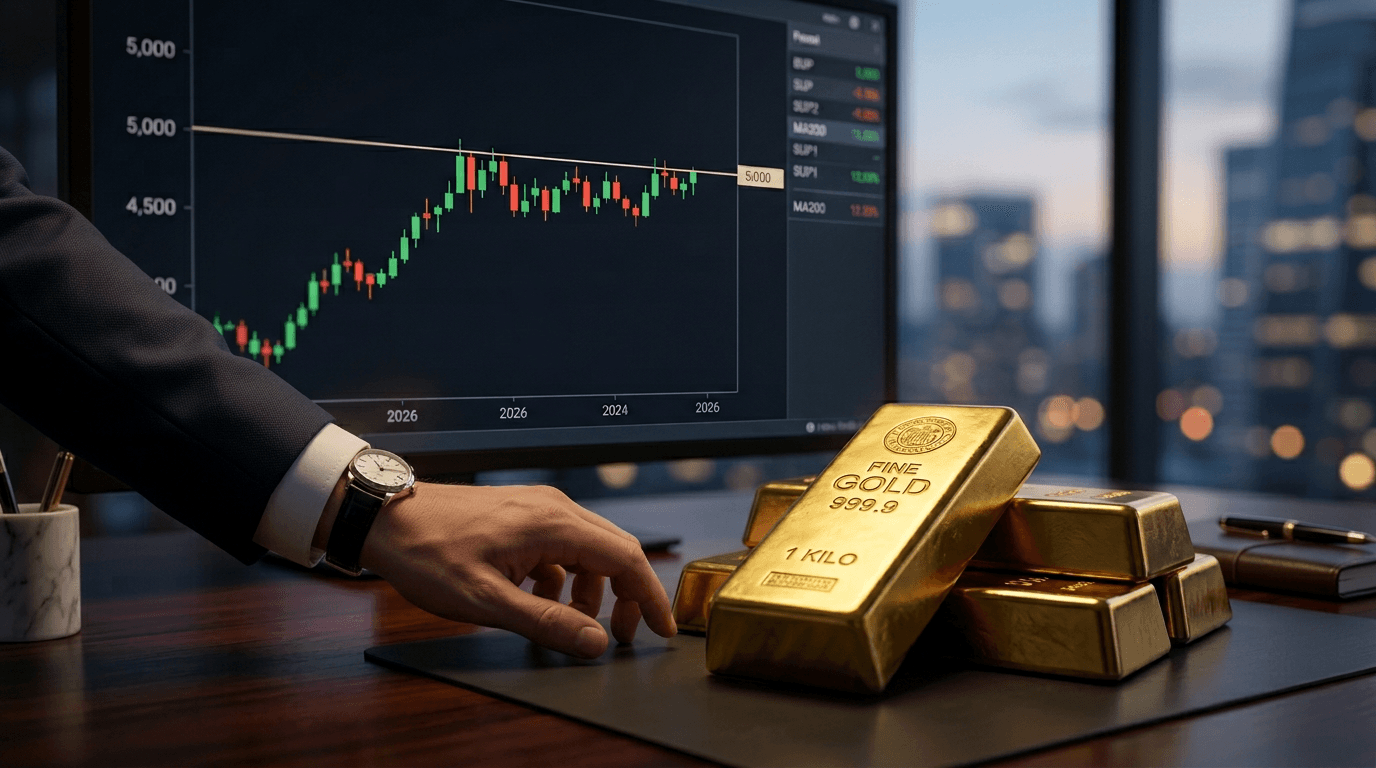
Gold has once again demonstrated its resilience at the psychologically critical $5,000 level, signaling a potential continuation of the structural bull market that has defined precious metals trading in 2025 and early 2026. Despite a violent 12.75% crash on January 30—the worst day for the metal since 1980—gold has found support near its 50% Fibonacci retracement level around $4,990, suggesting that the underlying bullish thesis remains intact even as short-term volatility tests the conviction of market participants.
The recent price action represents a crucial inflection point for traders and investors alike. After surging roughly 65% in 2025 and gaining another 30% through January 2026, gold entered a consolidation phase that has kept prices pinned near the psychologically significant $5,000 mark. This consolidation, bounded by a rising trendline from the February low near $4,402 and a descending resistance line from the previous high around $5,598, is creating what technical analysts call a symmetrical triangle. This pattern typically precedes a sharp directional move, and the fact that gold is holding key support levels suggests the breakout favors the upside.
Technical Confluence Creates Strong Support
The reason gold is holding firm around $5,000 lies in multiple layers of technical support that converge at this level. Most importantly, the $4,990 area coincides with the 0.5 Fibonacci retracement of the entire move from $4,402 to $5,598. In technical analysis, Fibonacci levels represent areas where buyers often step in after pullbacks, as these zones are widely watched by traders globally. The 50-period moving average has also flattened right at current price levels, while the 200-period moving average near $4,860 still slopes upward—a bullish signal that confirms the larger uptrend remains intact despite the recent consolidation phase.
On the downside, buyers have consistently defended the $4,900 level, with deeper structural support around $4,685 before considering the February swing low near $4,402. This layered support structure means that gold would need to break through multiple levels before the bullish case truly deteriorates. Conversely, a sustained move and close above $5,150 would validate a push toward $5,300 and potentially re-open the path to the recent highs near $5,600, demonstrating just how finely balanced the current price action truly is.
Structural Bull Market Drivers Remain Intact
While the technical setup is encouraging, the fundamental backdrop supporting gold prices remains even more compelling. The 2025 gold rally—the strongest annual performance since 1979—was powered by structural factors that show no signs of disappearing. These include Federal Reserve easing, robust central bank and retail demand, rising stock-bond correlations, and heightened concerns about global debt levels that have reached $340 trillion, with government debt comprising a record 30% of that total. At 3-4 times global GDP, these debt levels create genuine concern for investors seeking protection against currency debasement and inflation.
Central bank buying has proven particularly resilient. Despite reaching record high prices, physical demand in the second half of 2025 surprised to the upside, particularly from emerging market central banks and Chinese retail investors. This price-inelastic demand—meaning central banks will continue buying regardless of price—adds a significant tailwind to gold, as these purchases represent long-term holders with strategic accumulation goals rather than traders looking for short-term profits.
Federal Reserve Policy And Dollar Dynamics
One critical catalyst shaping 2026 gold prospects is the changing Federal Reserve landscape. Chair Jerome Powell's term ends in May 2026, and early indications suggest his successor may adopt a more dovish approach, responding more quickly to weakening economic data. Additionally, the Fed's decision to halt Quantitative Tightening marks an inflection point from balance sheet contraction toward a more supportive stance. These policy shifts tend to weaken the U.S. dollar by narrowing cross-border interest rate differentials and expanding liquidity in the system.
A weaker dollar creates a direct tailwind for gold, which is priced globally in USD. A lower greenback raises gold prices internationally and enhances global purchasing power, creating compounding demand from overseas investors. Leading financial institutions expect this dollar weakness to persist throughout 2026, driven by rate cuts, a lower neutral rate under new Fed leadership, and more supportive balance sheet management.
Forward Price Targets And Market Consensus
Wall Street consensus reflects rare agreement on gold's direction. JPMorgan sees gold topping $5,055 in the final quarter of 2026, while Goldman Sachs forecasts the same target supported by an average annual price of $4,275. Morgan Stanley projects gold at $4,400 by year-end. State Street Global Advisors maintains a bullish skew, assigning a 30% probability to gold prices hitting $5,000-$5,000 range, with scenarios for even further upside if central bank demand remains steady, ETF flows persist, or volatility shocks reignite safe-haven demand.
The bullish case rests on the persistence of the alternative fiat and global debasement trade—a theme that many analysts argue is still in its early innings. With systemic risk, fiscal expansion concerns, and dollar weakness providing a sturdy foundation, the $5,000 level increasingly appears to be a floor rather than a ceiling for this precious metals cycle.