
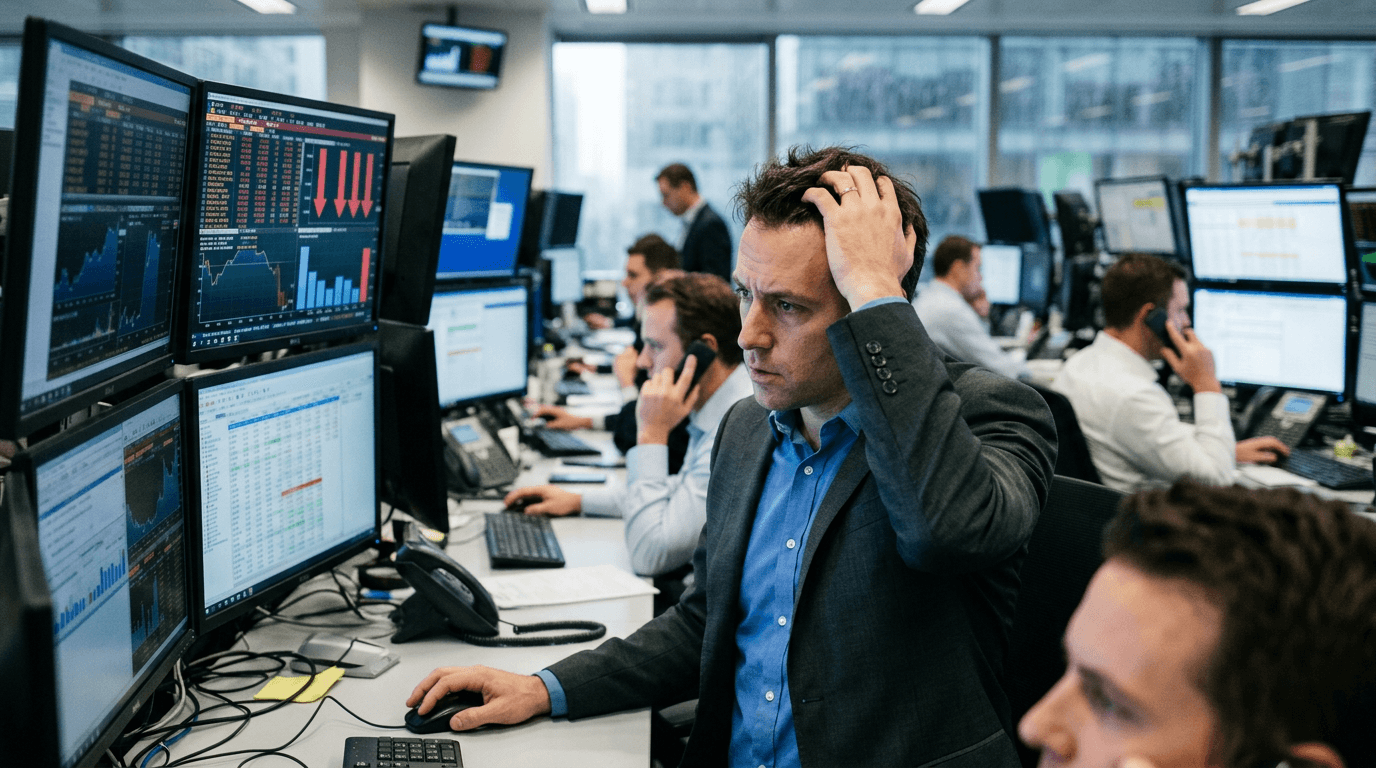
Markets are once again confronting the reality that the U.S.–China trade conflict never truly went away—it just went quiet. Beijing has now signaled that it is prepared to impose steep additional tariffs on certain U.S. goods, reportedly up to 125%, and has warned that continued U.S. tariff pressure “no longer makes economic sense” for China. For traders, this is not just political theatre; it is a potential catalyst for a broad risk‑off move across FX, equities, commodities, and futures curves.
WHAT IS HAPPENING – AND WHY IT MATTERS
This is not the first time markets have faced the threat of triple‑digit tariffs between the world’s two largest economies. In a previous phase of the dispute, Washington and Beijing only narrowly avoided a scenario in which U.S. tariffs on Chinese goods would have surged to 145% and Chinese tariffs on U.S. goods to 125%, after agreeing to a last‑minute 90‑day truce.[2] That episode established two important precedents: both sides are willing to threaten extremely high tariffs, and last‑minute deals can temporarily defuse tensions without resolving the underlying issues.
On the U.S. side, the current tariff architecture already includes broad additional ad valorem duties on imports from China, adjusted repeatedly via executive actions.[1] This creates a baseline of friction in the trading relationship. China’s latest signal—explicitly floating additional duties of up to 125% on selected U.S. products—raises the stakes and suggests that Beijing is prepared to retaliate more forcefully if Washington escalates again.
For markets, the key point is not only the direct trade impact, but the signal about policy direction: a shift away from de‑escalation back toward confrontation. That change in tone alone is enough to reprice risk.
How Tariffs Feed Into Global Growth And Risk Assets
Tariffs function as a tax on cross‑border trade. Higher duties raise costs for importers, compress margins for exporters, and ultimately filter through to prices and demand. When that tax is levied between two systemically important economies, the effects ripple globally.
The main macro channels to watch are
1) Global trade and growth: Higher tariffs, particularly in sensitive sectors like technology, autos, machinery, and agriculture, can dampen trade flows and investment. Firms may delay capex, re‑route supply chains, or hold excess inventory on the expectation of regulatory shifts.
2) Corporate earnings: Multinationals with China‑exposed supply chains or revenue streams—think industrials, semiconductors, luxury goods, and selected consumer brands—face margin pressure from higher input costs and potential demand weakness in China and the U.S.
3) Risk sentiment: Escalating tariffs are a textbook “risk‑off” driver. Investors typically reduce exposure to cyclical assets (equities, high‑yield credit, EM FX) and rotate toward perceived safe havens.
This is why the latest rhetoric is being treated as a downside risk for global growth and for risk assets more broadly. Even before any tariff is legally implemented, expectations alone can depress valuations, widen credit spreads, and steepen volatility curves.
FX MARKETS: SAFE HAVENS VS. CHINA‑SENSITIVE CURRENCIES
FX traders tend to react quickly to trade and tariff headlines, and this episode is no exception. Several patterns are worth highlighting:
Safe‑haven demand: The Japanese yen (JPY) and Swiss franc (CHF) typically benefit when uncertainty spikes. As traders price in the risk of weaker global growth and risk‑off positioning, JPY and CHF tend to find support, especially against high‑beta currencies linked to global trade.
China‑sensitive FX: Currencies of economies that are tightly integrated into China’s trade ecosystem can come under pressure. This includes Asian FX (such as KRW, TWD, and SGD) and commodity currencies with strong China demand exposure (AUD, NZD, and to a lesser extent CAD). Any hint of weaker Chinese import demand or slower industrial activity can weigh on these currencies.
The yuan complex: USDCNH and CNH crosses become barometers of sentiment around the trade relationship. While China manages its currency within a controlled framework, tariff threats often lead to expectations of a weaker yuan as a partial offset to higher trade barriers.
For traders in a simulated environment, this is an ideal time to study how FX pairs react not just to economic data, but to headline risk. The interaction between spot moves, volatility, and forward pricing around trade events is a powerful learning lab.
Equities, Commodities, And Futures Curves
In equities, the immediate focus is on China‑sensitive indices and sectors. Markets such as Hong Kong, mainland China, and export‑heavy indices in Asia and Europe can be particularly vulnerable. Sectors most exposed tend to include:
– Industrials and machinery, given their dependence on cross‑border supply chains and capital spending.
– Semiconductors and hardware, where the U.S.–China competition over technology and chips has already become a strategic flashpoint.
– Luxury and consumer brands with heavy China revenue, which are sensitive to both domestic Chinese demand and cross‑border trade restrictions.
Commodities also sit squarely in the line of fire. Agricultural exports like soybeans were a key target during earlier tariff rounds, and renewed measures could again shift trade flows and pricing. Industrial metals such as copper, which are closely tied to Chinese construction and manufacturing, can weaken on fears of slower growth. Energy markets may see a more mixed impact, as lower growth expectations pull prices down but geopolitical risk premia remain in play.
Forward and futures curves in both equities and FX can start to reflect higher uncertainty through:
– Wider calendar spreads, as markets price near‑term volatility and longer‑term normalization scenarios.
– Increased implied volatility in options on equity indices and FX pairs, especially around key negotiation dates or policy deadlines.
For SimFi traders, these shifts are invaluable for understanding term structure, risk premia, and how expectations about the future get embedded into today’s prices.
How Traders Can Navigate Heightened Tariff Risk
In a simulated trading environment, tariff flare‑ups offer a rich opportunity to practice managing event risk without real capital at stake. A few practical approaches:
Build scenario maps: Outline at least three paths—rapid de‑escalation, controlled escalation, and full‑blown tariff war. For each, think through implications for major FX pairs, equity indices, and commodities. Then compare your expectations to what the market is actually pricing.
Track cross‑asset signals: Don’t look at FX or equities in isolation. If tariff headlines hit and JPY and CHF rally, China‑sensitive equities sell off, and industrial commodities soften, the cross‑asset confirmation strengthens the trade thesis. If one market is out of sync, that may indicate either mispricing or an incomplete story.
Focus on risk management: Volatility around trade news can produce sharp intraday reversals and gaps. In a SimFi setting, practice using stop‑loss levels, position sizing, and diversification to manage these swings. The goal is not just to “be right” directionally, but to build robust trade structures that can survive noise.
Learn from previous episodes: Review how markets behaved during earlier tariff scares—how long risk‑off moves lasted, which assets led, and what signals preceded de‑escalation. Past behavior during the 90‑day tariff truces and threatened triple‑digit duties offers a useful template for today’s environment.[2]
Ultimately, tariff tensions between the U.S. and China are unlikely to disappear. They have become a structural feature of the global landscape, periodically flaring into episodes that can jolt markets. For traders, the challenge is to move beyond the headlines and think in terms of probabilities, cross‑asset relationships, and disciplined risk management. A simulated trading platform provides the ideal sandbox to hone those skills—so when the next round of tariff drama hits, you are ready to trade the reaction, not just react to the news.