
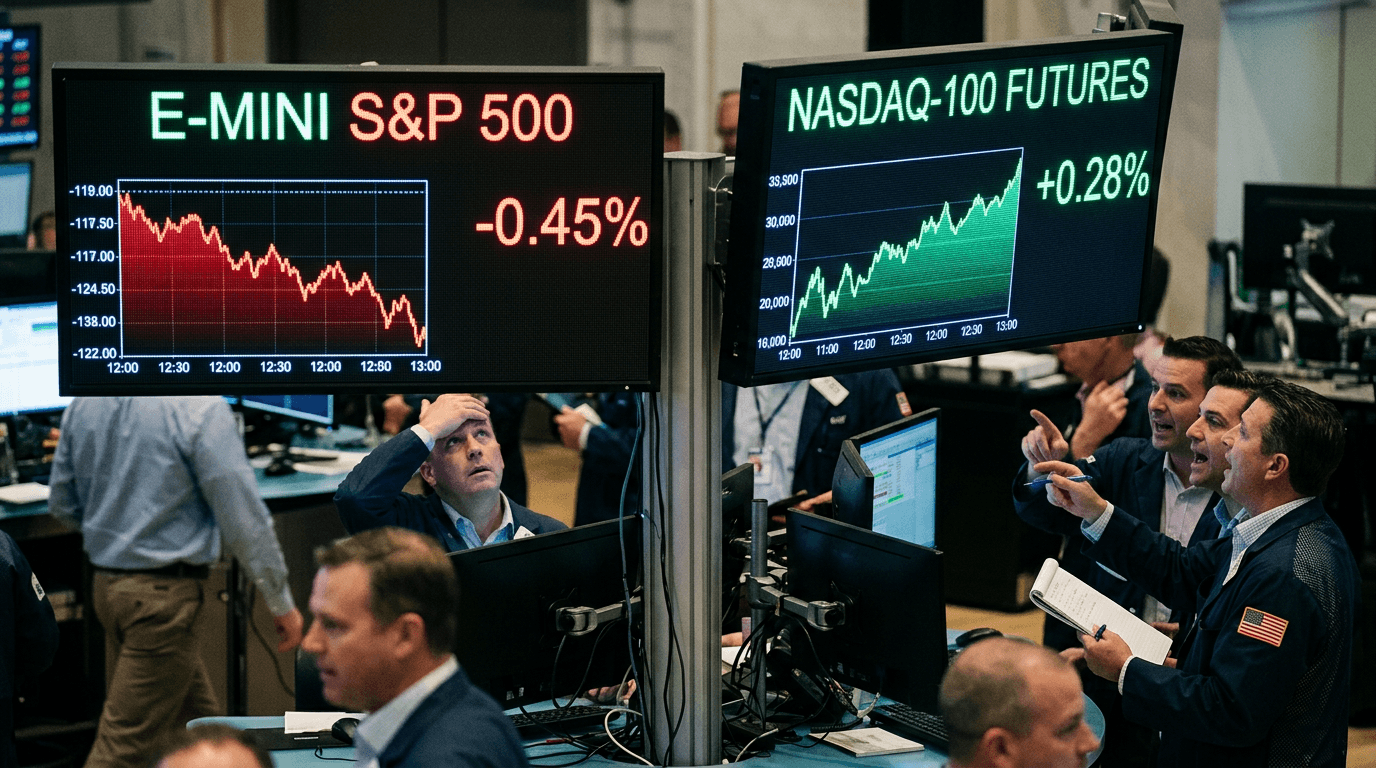
Risk sentiment in U.S. equity futures is sending a mixed message, with E‑mini S&P 500 contracts slipping while Nasdaq futures edge higher as traders recalibrate around stronger economic data and stickier rate expectations.[2][5][12][13] This pattern underscores how index futures can diverge even on the same macro news, revealing where capital is rotating beneath the surface.[5][10][11] For traders on SimFi platforms like E8 Markets, understanding these nuances is critical to building realistic strategies that respond to evolving risk tones rather than headline moves alone.[6][15]
Mixed Risk Tone In Index Futures
Recent quotes show September E‑mini S&P 500 futures around 7,722, down roughly 0.4% on the session, reflecting mild risk‑off pressure in broad U.S. equities.[2][8][14] By contrast, E‑mini Nasdaq 100 futures have been slightly positive or less negative, hinting at relative resilience in growth and technology names.[5][10][11] This split between large‑cap benchmarks and tech‑heavy indices is a classic sign of a “mixed risk tone” rather than a clear‑cut risk‑on or risk‑off day.[5][10][12]
Stronger U.S. data, including firm inflation and steady GDP growth, has kept the market focused on the possibility that policy rates stay higher for longer.[12] Broad indices like the S&P 500, which include rate‑sensitive sectors such as financials, real estate, and defensives, tend to struggle when yields stay elevated and discount rates rise.[2][3][4] At the same time, selected tech and growth leaders can hold up if investors believe their earnings trajectories and secular themes can outpace the drag from higher rates.[5][11][15]
What The Move Says About Rates And Growth
Economic releases tied to inflation and consumer demand have recently surprised to the upside, reinforcing the idea that the U.S. economy remains resilient even as policy remains restrictive.[12] For futures traders, this combination often translates into higher implied yields and lower valuations on broad equity indices, which is consistent with the modest pullback in E‑mini S&P 500 futures.[2][3][8][14] The fact that Nasdaq futures are comparatively firmer suggests markets are differentiating between cyclical exposure and long‑duration growth stories rather than selling everything indiscriminately.[5][10][11]
In simulated trading environments, this context is ideal for practicing rate‑sensitive strategies. For example, traders can back‑test how different sectors within the S&P 500 respond when real yields rise, then compare those behaviors to the Nasdaq’s heavier concentration in software, semiconductors, and platform businesses.[5][10][11] This helps build intuition around why the same macro release can knock ESU26 lower while supporting relative strength in NQ contracts on a given day.[2][5][13][15]
Rotation Beneath The Surface
The divergence between E‑mini S&P and Nasdaq futures signals rotation rather than a simple market‑wide selloff.[2][5][10] Under the hood, investors may be trimming exposure to more rate‑sensitive names or crowded trades in cyclical sectors while adding selectively to high‑conviction growth and technology leaders.[5][11][15] Historical data for Nasdaq futures shows that tech‑heavy indices often outperform during periods when growth expectations remain solid but discount rates move higher, especially if earnings revisions stay positive.[9][11][15]
For simulated traders, this is an opportunity to study cross‑index relative value. One practical exercise is to track spread relationships between E‑mini S&P and E‑mini Nasdaq futures, observing how the spread widens or narrows on days with key economic releases or central bank commentary.[5][10][12] Another is to construct sector‑tilted “synthetic” portfolios within a SimFi environment, overweighting tech relative to financials or utilities and measuring performance through different rate regimes.[6][15]
Implications For Simulated Traders
E‑mini contracts are highly efficient instruments for expressing views on macro data and sector dynamics, with standardized tick sizes, margin requirements, and trading hours that make them accessible in both live and simulated markets.[6][14][15] On platforms like E8 Markets, traders can use ES and NQ futures to test how quickly their strategies adapt when the market tone shifts from broad optimism to a more selective, mixed risk environment.[6][15] Because these contracts trade nearly around the clock, they offer rich intraday data for modeling reaction functions to news and assessing liquidity conditions at different times of day.[6][8]
A key takeaway from the current setup is that headline index direction rarely tells the full story. E‑mini S&P weakness may coexist with pockets of strength in Nasdaq and other growth proxies, especially when investors believe productivity, AI, or digital transformation themes can offset rate pressures.[5][10][11] Simulated traders who only look at one index may miss these rotations, whereas those who compare futures across benchmarks can better understand where risk is actually being repriced.[2][5][15]
PRACTICAL PLAYBOOK FOR E‑MINI AND NASDAQ FUTURES
There are several actionable ways to turn today’s mixed risk tone into learning and strategy development:
1. Map macro events to index behavior Build a simple event log linking major data releases (inflation, GDP, jobs) to subsequent moves in ES and NQ futures, noting whether spreads widen or narrow.[5][10][12] This helps clarify which releases tend to favor broad indices versus tech‑heavy benchmarks.
2. Practice relative value trades in simulation Use your SimFi account to structure paper trades that go long E‑mini Nasdaq futures and short E‑mini S&P futures, or vice versa, based on your macro view.[5][10][15] Track performance through different data cycles to see how correlations and volatilities evolve.
3. Stress‑test strategies for rate shocks Create scenarios where policy expectations shift abruptly, such as an unexpected hawkish tilt or stronger‑than‑forecast inflation print.[12] Then test portfolio responses using ESU26 and corresponding Nasdaq futures to ensure position sizing and risk limits are robust in both directions.[2][5][6]
4. Incorporate sector and factor thinking Even though index futures are broad instruments, overlay sector and factor analysis—growth vs. value, duration vs. cyclicals—to refine entry and exit rules.[5][11][15] Simulated trading allows experimentation with these overlays without capital at risk, helping traders learn how mixed risk tones play out beyond the headline move.
Conclusion
E‑mini S&P 500 futures slipping while Nasdaq futures edge higher reflects a market that is neither fully risk‑on nor risk‑off, but selectively rewarding perceived long‑term winners amidst higher‑for‑longer rate expectations.[2][5][12][13] For traders, especially those using SimFi platforms like E8 Markets, this environment offers a valuable laboratory for understanding rotation, relative value, and macro sensitivity in index futures.[6][15] By focusing on spreads, sector dynamics, and rate scenarios—not just single‑index direction—traders can turn mixed risk tones into clearer insights and more resilient strategies for both simulated and live markets.