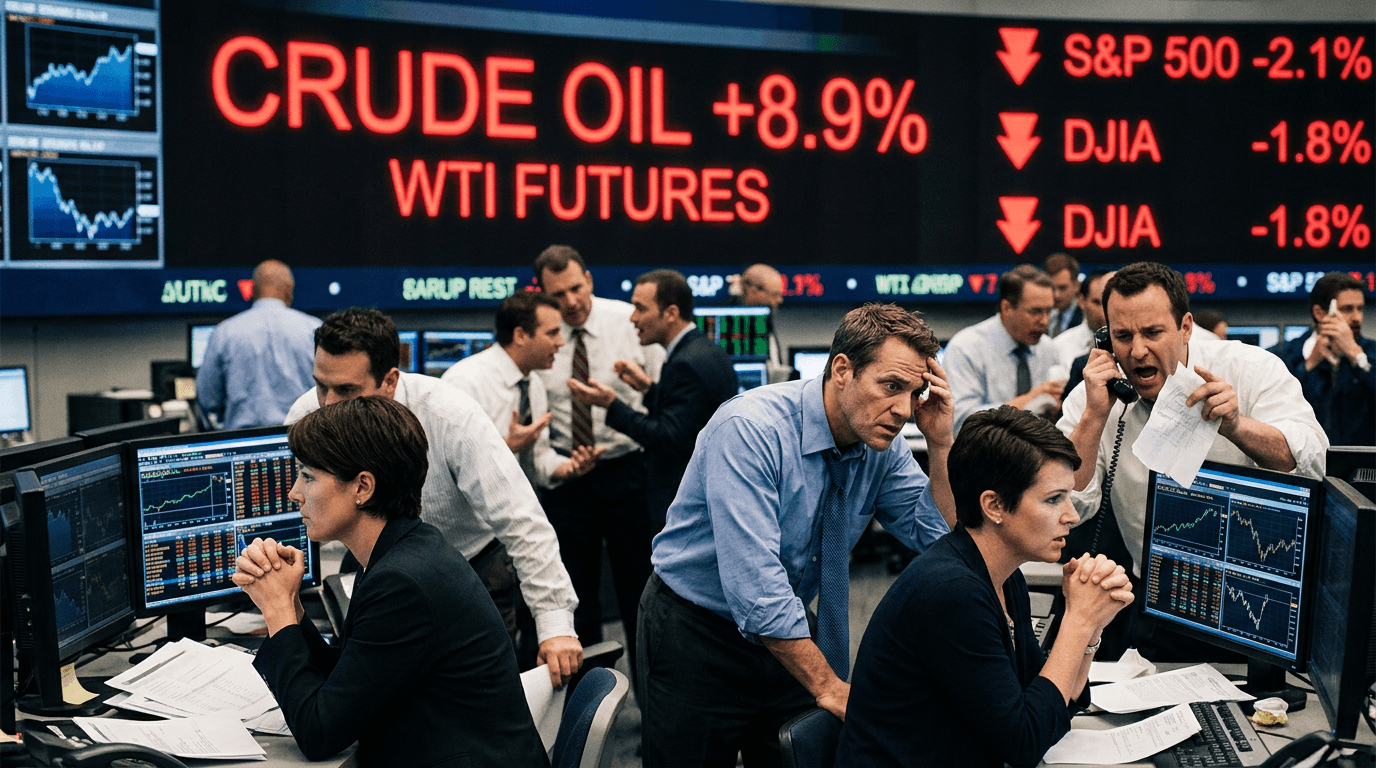
Oil markets just delivered a stark reminder that geopolitics can move prices faster than economic data. U.S. crude futures jumped roughly 9% to trade above $81 a barrel, while Brent approached $86, as traders reacted to the escalating war with Iran and mounting fears over global supply. The shock rippled across asset classes: U.S. equities slipped, the dollar caught a bid, and investors rotated toward safe‑haven assets, underscoring how quickly a regional conflict can become a global macro event.
What Just Happened In Oil And Stocks
The immediate catalyst was an intensification of the conflict with Iran, which raised the perceived risk of disruptions to Middle Eastern oil flows. That repricing of risk showed up as a sharp spike in crude futures, with intraday moves that would have looked extreme even in already-volatile energy markets.
On the equity side, U.S. benchmarks pulled back as investors reassessed earnings prospects in a world of potentially higher energy costs and greater geopolitical uncertainty.[3] European and Asian markets also traded lower as attacks on regional energy infrastructure pushed fuel prices higher and weighed on risk sentiment.[3] The Morningstar Europe Index, for example, has fallen close to 8% since the conflict began, putting it on track for its worst month since mid‑2022.[3]
At the same time, the dollar strengthened as global investors sought liquidity and safety, a classic “risk‑off” pattern that often appears when geopolitical headlines dominate trading desks. While the oil move grabbed attention, the cross‑asset reaction is what confirms this as a macro shock rather than just a sector story.
Takeaway: This is not just an energy headline; it is a broad risk‑off move where crude, equities, and currencies are all adjusting to a higher perceived geopolitical risk premium.
Why Geopolitical Shocks Hit Oil So Hard
To understand the magnitude of the reaction, you have to start with the geography. Roughly 20% of global seaborne crude oil passes through the Strait of Hormuz, a narrow waterway bordered by Iran that is one of the most critical chokepoints in the world energy system.[1] Any conflict involving Iran immediately raises the probability—however small—of disruptions or blockades in this corridor.
Recent analysis suggests that a severe and sustained disruption in the Strait could remove on the order of 10–15 million barrels per day from global supply, an enormous shock relative to normal market balances.[4] Even the possibility of that kind of loss forces traders to re‑price crude sharply, because inventories and spare capacity are not built to easily absorb a shock of that magnitude.
Energy economists also stress that these disruptions are not easily reversible. Even if a peace deal were reached quickly, it could take months to clear mines, restore shipping, and normalize flows through the region.[4][5] That means today’s price move is not just about today’s barrels; it is about the path of supply over the next several quarters.
In futures markets, this shows up as a surge in nearby contracts and a shifting term structure, as traders price in both immediate scarcity and longer‑term uncertainty. Intraday swings can be amplified by algorithmic trading, forced position exits, and margin calls, which help explain the “whipsaw” price action seen in prior episodes of U.S.–Iran tension.[1]
Takeaway: Because so much oil flows through a geopolitically fragile chokepoint, even a modest increase in disruption risk can translate into an outsized move in crude futures.
How Energy Shocks Filter Into Equities, Fx, And Rates
Oil spikes rarely stay confined to the commodities complex. They change the macro conversation, and equities are often the first place traders look for second‑order effects.
Higher crude prices compress margins for energy‑intensive industries such as airlines, shipping, chemicals, and some manufacturers. For these sectors, fuel is a major input cost; when oil jumps nearly 10% in a day, forward earnings estimates and valuation multiples can adjust quickly. Consumer‑facing companies can also feel the squeeze as higher fuel prices act like a tax on households, potentially dampening discretionary spending.
On the flip side, energy producers, oilfield services firms, and some midstream companies can benefit from higher prices, at least in the short term. This creates a classic sector rotation dynamic: broad indices may decline modestly even as energy sub‑indices outperform.
Globally, the equity reaction has been muted but clearly negative, with U.S. benchmarks down modestly and European and Asian indices seeing more pronounced declines as they digest both higher energy costs and conflict‑driven uncertainty.[3] That divergence is consistent with the fact that many economies outside the U.S. are more directly exposed to imported energy prices.
In currencies, a risk‑off oil spike tends to support the U.S. dollar, both because of its safe‑haven status and because higher energy prices can hurt net importers’ trade balances. For central banks, a sustained move higher in oil raises uncomfortable questions: does it reignite inflation, forcing a more hawkish stance, or slow growth enough that policy must stay supportive? Current communication from major central banks already reflects a high degree of uncertainty about the economic outlook.[3]
Takeaway: An oil shock is a macro shock—affecting sector earnings, global growth expectations, currency flows, and central bank calculus, not just energy names.
What This Means For Active Traders And Simulated Trading
For active traders, oil‑driven macro shocks present both opportunity and elevated risk. Volatility rises across futures, options, and equities, increasing the potential reward for correct positioning but also the likelihood of being whipsawed by headlines.
In crude futures and options, implied volatility typically jumps, widening bid‑ask spreads and increasing slippage. Position sizing and risk limits that felt conservative in a low‑vol regime can suddenly look aggressive when intraday ranges expand. Understanding term structure dynamics—such as backwardation steepening as near‑dated contracts surge—is critical for spread and roll strategies.
Equity traders must think in terms of relative performance. Simple “risk‑off” selling may miss important dispersion: energy and defense stocks can diverge sharply from consumer and industrial names. Macro traders may look at equity index futures, volatility indices, and sector ETFs as tools to express views on how persistent the oil shock will be.
This is also an environment where simulated trading can be particularly valuable. Practicing strategies in a risk‑free environment allows traders to test how their systems behave under gap moves, wider spreads, and rapid headline‑driven reversals. It can help refine rules around stop placement, news filters, and intraday risk caps before capital is put at risk in live markets.
Takeaway: Elevated volatility magnifies both opportunity and execution risk, making disciplined risk management and strategy testing essential.
What To Watch Next
Going forward, traders and investors will focus on a few key variables to gauge whether this spike is a short‑term shock or the start of a longer regime shift in energy prices.
First, the trajectory of the conflict itself and any developments around the Strait of Hormuz will be critical. Signals about shipping conditions, insurance costs, and naval activity in the region can move markets as much as traditional supply‑demand data.[1][4] Any sign of escalation that threatens sustained disruption could push crude significantly higher; credible de‑escalation could see some of the geopolitical risk premium unwind.
Second, the response from major producers—including OPEC+ and U.S. shale—will matter. If spare capacity is mobilized quickly and credibly, it can cushion the impact of regional outages. If not, the market will treat the shock as more structurally bullish for crude.
Third, inventory data, refinery margins, and product prices (diesel, jet fuel, gasoline) will provide clues about how the shock is filtering through the real economy.[4] Sharp squeezes in refined products are often where the pain is felt first, especially in transport and logistics.
Finally, central bank communication and bond market pricing will reveal how policymakers interpret the shock: as a temporary spike or a renewed inflation threat layered onto an already uncertain growth backdrop.[3] For multi‑asset traders, these signals are as important as the next tick in oil.
Takeaway: Watch the conflict path, shipping flows, producer responses, and central bank signals to judge whether this is a one‑off spike or the beginning of a new, higher‑volatility regime for energy markets.