
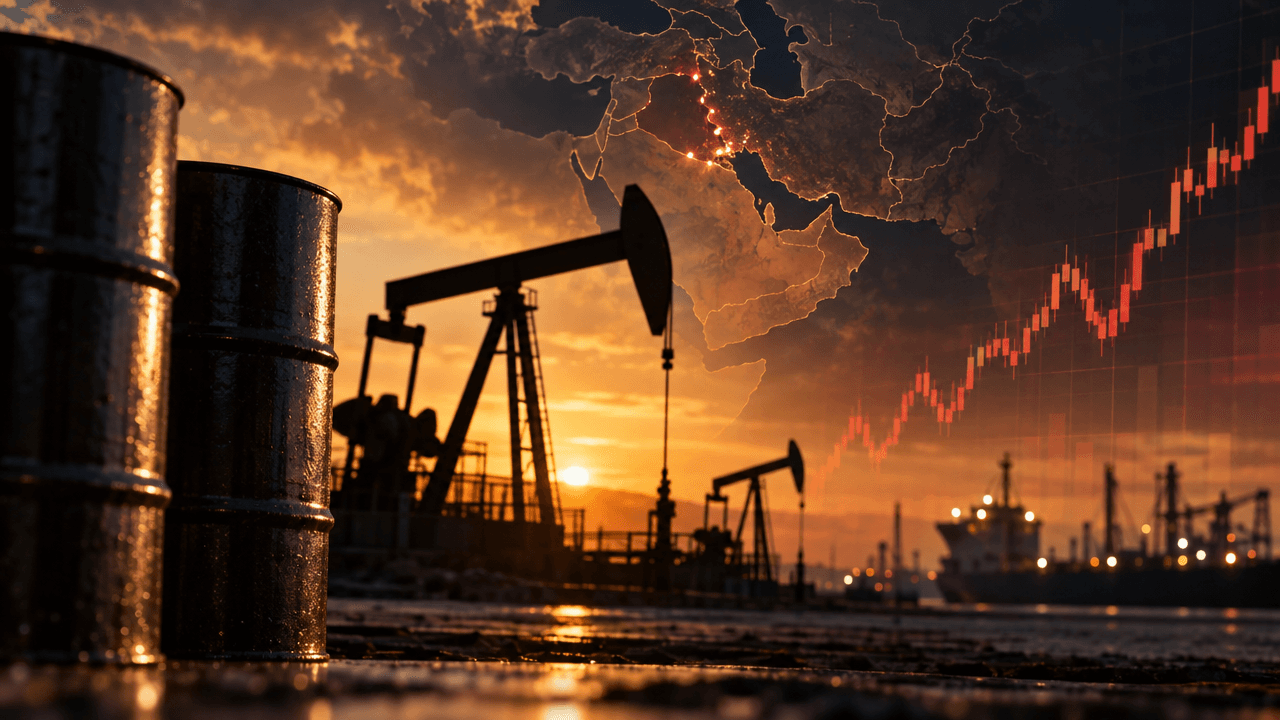
Oil is once again flirting with triple digits, with Brent crude holding near $100 a barrel and WTI trading above $90 as traders price in a new wave of geopolitical risk across the Middle East.[2][3][7] Reports of attacks involving Saudi energy assets and shipping, alongside renewed concerns around the Strait of Hormuz, have pushed a supply-risk premium back into the market just as inventories have been drawn down.[3][7][12] For active traders, this is a textbook example of how geopolitics, physical logistics, and fundamental data intersect to drive price action in global commodities.[3][7][10]
WHY OIL IS CLINGING TO $100
The current move in crude is not just a speculative spike; it reflects a clear supply-risk premium layered on top of genuine demand recovery.[7][10][2] Analysts tracking Brent’s break above $100 note that the price structure shows a wide differential consistent with Middle East supply shocks, rather than purely cyclical demand strength.[7][10][1] In other words, traders are paying extra for the risk that barrels may not reach end-users even if production capacity exists.[7][10][12]
At the same time, global demand has rebounded enough that the market is less able to absorb fresh disruptions.[7][10][3] Months of reduced exports through the Strait of Hormuz and other regional chokepoints have contributed to inventory drawdowns, leaving fewer stockpiles to cushion new shocks.[3][12][1] One set of shipment estimates suggests that around 10 million barrels per day of exports are missing compared with pre-conflict flows, highlighting how tight the balance has become.[3][11][14]
A reported decline in U.S. crude inventories has reinforced this dynamic, signaling that key consuming regions are running leaner on storage just as headline risks intensify.[2][7] For price behavior, this combination—firm underlying demand, thinner inventories, and supply routes under threat—is exactly the backdrop where $100 oil tends to be “sticky” rather than fleeting.[1][7][12] Simulated traders should recognize that in such environments, the upside tails in price distributions widen, and mean-reversion strategies can become more hazardous without robust risk controls.[7][10]
Middle East Flashpoints: Saudi Arabia And Shipping Lanes
The latest leg of the rally is closely tied to escalating attacks on energy infrastructure and tanker traffic linked to Saudi Arabia, OPEC’s largest exporter.[3][6][14] Iran‑aligned Houthi forces have claimed strikes on Saudi facilities and vessels, setting some installations ablaze and raising the possibility that disruptions could spread beyond isolated targets.[3][6][9] These incidents matter because they touch both production assets and the logistics chain that moves oil to global buyers.[6][11][15]
Shipping lanes have become focal points for risk. The Strait of Hormuz—through which roughly a fifth of global oil supply once passed—has seen traffic constrained amid attacks and threats to close the waterway.[11][12][15] At the same time, the Bab el‑Mandeb strait and Red Sea routes, which Saudi Arabia has used as alternative corridors, are now under pressure from attacks on tankers and talk of blockades.[6][8][9] When both primary and backup routes face disruption risk, traders start pricing in not just delays, but the possibility of sustained loss of effective supply.[3][11][13]
Saudi Arabia has reportedly diverted some exports away from the most threatened lanes, but analysts warn that persistent attacks could complicate efforts to keep crude flowing smoothly.[4][6][12] The concern is not only about barrels being temporarily stranded; it is about the higher cost of shipping, insurance, and rerouting, all of which feed back into delivered prices.[1][12][15] For market participants, the lesson is that you cannot analyze oil purely through production figures—you must track transit security, shipping patterns, and regional political developments in real time.[3][6][13]
Macro And Market Implications
A sustained period of oil above $100 per barrel has implications far beyond energy markets.[3][11][14] Higher crude prices raise transport and manufacturing costs, feeding into broader inflation pressures at a time when many central banks are still trying to anchor expectations.[3][11][14] Some analysts warn that prolonged price strength could keep interest rates higher for longer, tightening financial conditions and reshaping risk appetites across asset classes.[3][11][14]
Equity markets, especially in energy‑intensive sectors such as airlines, chemicals, and logistics, can see margin compression as fuel costs climb.[3][11][12] Emerging market importers face additional stress through weaker currencies, rising subsidy burdens, and potential balance‑of‑payments pressures.[3][11][13] On the flip side, oil‑exporting countries may benefit from stronger fiscal positions, but that windfall is tempered by increased geopolitical uncertainty and volatility.[3][12][15]
For portfolio construction—whether in live markets or simulations—higher oil prices alongside elevated volatility can change correlations and regime dynamics.[7][10][3] Energy equities may decouple from broader indices, inflation‑sensitive assets like inflation‑linked bonds or commodities baskets can gain renewed relevance, and traditional hedges may behave differently under stress.[3][7][11] Observing how simulated portfolios react to energy shocks gives traders valuable insight into where they might be overexposed or under‑hedged in real markets.[7][10]
What Simulated Traders Should Watch
SimFi environments are ideal for stress‑testing strategies against complex scenarios like the current Middle East‑driven oil spike.[7][10] To make the most of this backdrop, traders can focus on several practical angles.
1) Separate demand from risk premium. Use simulated positions to model how prices might behave if geopolitical tensions ease but underlying demand remains firm, versus a scenario where demand slows while tensions persist.[7][10][1]
2) Track inventory and shipment data. In both real and simulated trading, follow weekly inventory reports and any evidence of shipping disruptions or rerouting through key chokepoints like Hormuz and Bab el‑Mandeb.[3][11][12]
3) Monitor cross‑asset impacts. Observe how simulated equity indices, FX pairs, and rates curves respond to different oil price paths, and identify where your strategies are most sensitive to energy shocks.[3][7][11]
4) Practice event‑driven risk management. Use simulated headlines—attacks, ceasefires, diplomatic breakthroughs—to test how quickly you adjust exposure, rebalance portfolios, or implement hedges when the narrative shifts.[3][6][13]
By treating the current situation as a live case study, traders can sharpen their ability to distinguish signal from noise, refine position sizing, and improve contingency planning without risking capital.[7][10]
Looking Ahead
The defining feature of today’s oil market is uncertainty: risk premia can build over weeks and evaporate in a single session if a credible agreement emerges around critical transit routes like the Strait of Hormuz.[10][12][15] Scenario analysis suggests a wide range of potential outcomes—from a swift de‑escalation that pulls Brent back into the $80s, to prolonged disruptions that could push prices towards $120 or higher in extreme cases.[3][11][14] For now, as Middle East risks intensify and inventories remain tight, the path of least resistance for oil appears higher, with volatility elevated.[3][7][12]
Simulated finance platforms give traders a controlled environment to navigate this volatility, test hypotheses, and prepare for real‑world decision‑making in a high‑stakes commodity landscape.[7][10] Whether the current episode proves to be a brief flare‑up or the start of a longer regime of elevated energy prices, those who invest time in understanding the drivers—and in rehearsing their responses—will be better equipped when the next major move arrives.[3][7][11]