
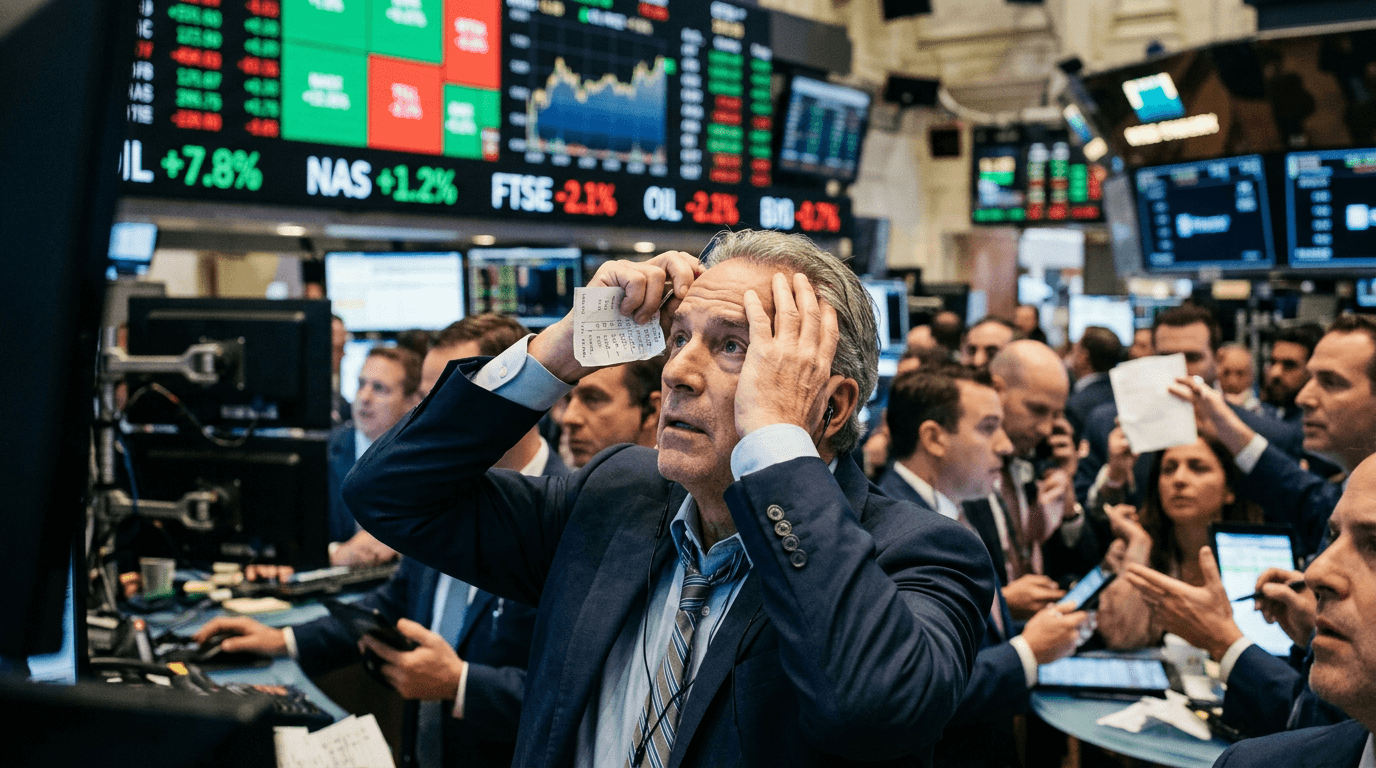
Oil’s latest surge, with prices jumping roughly 7–9% after renewed US–Iran strikes near the Strait of Hormuz, is more than just another geopolitical headline. It is a reminder of how quickly energy shocks can ripple through risk assets, inflation expectations, and central bank policy narratives. For traders and investors, this move is a live stress test of positioning, hedging, and scenario planning in an increasingly fragile macro environment.
Market Reaction: Oil Spikes, Risk Assets Stumble
The immediate impact has been a sharp repricing of crude. West Texas Intermediate pushed into the low‑$80s and Brent into the mid‑$80s, mirroring earlier episodes when Gulf tensions sent U.S. crude up 6–8% and Brent over 7% in a single session[5]. Risk assets have responded in textbook fashion: equity indices and futures slipped, credit spreads widened, and volatility ticked higher, echoing previous US–Iran flare‑ups when benchmarks like the FTSE 100 dropped around 1.5–2% on the day[2].
This kind of move is not just about the headline percentage change. A single‑day jump of 7–9% in crude compresses months of typical price drift into hours, forcing systematic strategies, risk parity portfolios, and options books to rebalance. In simulated trading environments, such shocks are ideal case studies for how stop losses, margin, and cross‑asset correlations behave under stress.
Why The Strait Of Hormuz Matters
The market’s sensitivity to this region stems from one simple fact: the Strait of Hormuz is the choke point for roughly 20% of the world’s oil flows[4]. Any threat to shipping lanes, ports, or energy infrastructure in and around the strait instantly translates into perceived supply risk. Past closures or blockades, even short‑lived, have driven Brent and WTI sharply higher as traders priced scenarios ranging from temporary disruption to full‑scale embargo[4][8].
Beyond crude itself, shipping disruption feeds into freight rates, insurance premia, and refinery margins. When tankers face higher risk or delays, refiners may pay more for prompt cargoes, while longer‑dated supply becomes less certain. That uncertainty is what markets are now discounting into the forward curve: stronger near‑term prices, steeper backwardation, and higher implied volatility.
Key takeaway: - When a major choke point like Hormuz is involved, price action reflects not just current supply, but the probability distribution of future disruption.
INFLATION AND THE HIGHER‑FOR‑LONGER FED NARRATIVE
The renewed spike in oil prices lands at a delicate moment for the inflation narrative. Energy’s direct weight in consumer price indices has fallen over time, but it remains a key driver of headline inflation and a catalyst for “second‑round” effects via transport, food, and manufactured goods[1]. In prior episodes, strategists have warned that sustained crude gains can push central banks toward more hawkish stances, even if core inflation is gradually easing[1][7].
For the Federal Reserve, a 7–9% jump in crude does not automatically change the policy path. What matters is whether the move persists and bleeds into broader inflation expectations. If gasoline, diesel, and jet fuel prices hold higher for weeks or months, households feel the pinch, breakeven inflation rates drift up, and the Fed’s confidence in the disinflation process erodes. That is where “higher‑for‑longer” comes into play: even if the hiking cycle is largely complete, a renewed energy shock can delay rate cuts or maintain restrictive real yields for longer.
Key takeaways: - A brief oil spike is noise; a sustained shock can re‑anchor inflation expectations. - Traders should watch breakevens, gasoline futures, and Fed communication for signs that energy prices are shifting the policy bias.
PRESSURE ON RISK ASSETS AND CROSS‑ASSET DYNAMICS
Equities typically react negatively to sharp energy price spikes, especially when driven by geopolitical conflict rather than strong demand. Higher input costs compress margins for energy‑intensive sectors, while the prospect of stickier inflation raises discount rates for long‑duration growth stocks. Past Hormuz‑related episodes saw broad indices slide and futures on major benchmarks drop around 1–1.5% as oil ripped higher[2][5].
At the same time, there is nuance beneath the surface: - Energy producers and oil‑service names often rally sharply, offsetting broader market weakness. - Airlines, logistics, and certain consumer sectors underperform as fuel costs rise. - Safe‑haven assets like the dollar and Treasuries can catch a bid if risk aversion spikes, though higher inflation risk complicates the bond story.
For multi‑asset traders, the key is understanding correlation shifts. In “normal” environments, stocks and oil may rise together on global growth optimism. In conflict‑driven spikes, that correlation can flip: oil up, stocks down, volatility up. Simulated portfolios are well‑suited to testing these regime changes without capital at risk.
Trading And Simfi Implications: How To Turn News Into Scenarios
For SimFi participants and active traders, this kind of event is a practical template for building and testing macro scenarios:
1. Map the transmission chain Start with the shock (US–Iran strikes, Hormuz risk), trace it through crude and refined products, then into inflation expectations, central bank reaction, and finally risk assets. Each link offers potential trade expressions: crude futures, energy equities, breakevens, index futures, FX.
2. Distinguish between short‑term spike and structural shift Use term structure and options data to gauge whether the market sees this as a brief flare‑up or a more enduring regime change. Steep backwardation and elevated near‑term implied volatility suggest a focus on short‑term disruption, while strength in longer‑dated contracts hints at deeper concern.
3. Stress‑test positions In a simulated environment, run scenarios where crude stays elevated, where the strait suffers a longer closure, or where diplomacy rapidly defuses tensions. Examine portfolio P&L under each path: which assets are most exposed, which hedges work, and where concentration risk is highest.
4. Focus on risk management basics News‑driven spikes are when slippage, gap risk, and liquidity constraints become real. Practice placing stops with realistic buffer, sizing positions for volatility, and planning exits in both favorable and unfavorable scenarios. SimFi platforms allow traders to learn these lessons in a risk‑controlled context.
What Traders Should Watch Next
The immediate move in oil is only the first chapter. Traders should now monitor: - Diplomatic signals and military posture around the Strait of Hormuz. - Shipping data, tanker traffic, and any signs of sustained disruption. - Inflation data releases and market‑based inflation expectations. - Fed and other central bank commentary on energy and inflation risks.
The current 7–9% surge in oil prices underscores how geopolitics, macroeconomics, and markets intersect. For traders, whether in live markets or simulated environments, the goal is not to predict every headline but to build robust frameworks that can absorb shocks, adapt to new information, and turn volatility into a learning and opportunity set rather than just a source of risk.