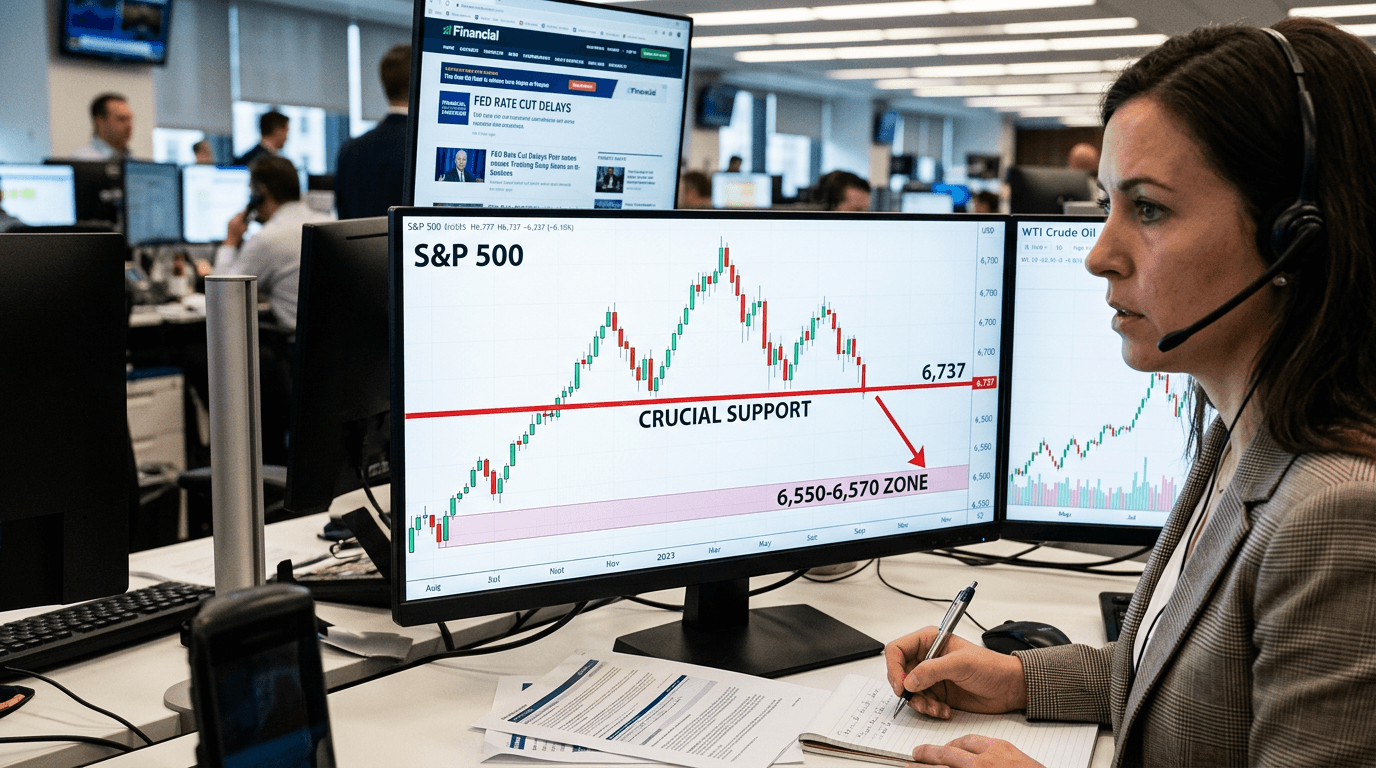
The S&P 500 is standing at a critical juncture as the index tests crucial structural support near the 6,737 level. This is far more than routine consolidation—it represents a pivotal moment where technical breakdowns could cascade into significant market moves. For traders and investors, understanding both the technical patterns and fundamental pressures at play is essential for managing risk in the current volatile environment.
Understanding The Head And Shoulders Pattern
The most concerning technical development is the formation of a head and shoulders pattern on the S&P 500 chart, with a critical breakdown level at approximately 6,790. In technical analysis, this pattern carries special significance because the neckline represents structural change in market character. When violated, very little structural support exists immediately below, creating what traders call an "air pocket"—a void where prices can drop rapidly with limited stopping points.
The S&P 500 has already been exhibiting a classic pattern of lower highs and lower lows, technical signals that indicate underlying weakness beneath the surface. Each successive test of the critical trendline support near 6,790 over the past month weakens the structural integrity of that level. If the index closes below 6,790 on a daily basis, the measured move on the head and shoulders pattern extends down to the 6,550 to 6,570 range. This is not just a statistical target—it represents a potential capitulation zone where significant selling pressure could emerge.
The distinction between an intraday test of support and a confirmed daily close below it cannot be overstated. A brief dip below 6,790 during regular trading hours is what traders call a "shake-out," designed to trigger stop losses and create panic. A confirmed close below this level, however, signals genuine capitulation and often leads to accelerated selling as technical traders and algorithms respond to the broken support level.
Macro Pressures Amplifying Technical Risk
The technical weakness cannot be isolated from fundamental headwinds building in the broader economy. Oil prices are rallying sharply, driven by geopolitical tensions and supply concerns that translate directly into inflation fears. Higher crude prices threaten both economic growth and corporate profit margins, creating what traders call a "double squeeze" on equity valuations. When companies face margin compression from rising input costs while simultaneously dealing with slower demand, earnings forecasts typically need to be revised downward.
This inflationary backdrop is forcing the Federal Reserve to delay rate cuts that the market had previously priced in. Market expectations now suggest that rate relief will not arrive until September 2026, pushing back the timeline investors relied upon. This policy delay removes a key pillar of support for equity prices. When the implicit safety net that investors expect from accommodative central bank policy is pushed back months, equity markets must stand on their own fundamentals. Currently, those fundamentals are eroding.
Beyond rate expectations, a private credit crisis is slowly developing in the background, creating systemic risks that many investors are not adequately positioned for. The combination of delayed Fed cuts, higher oil prices, and rising inflation expectations creates an environment where technical breakdowns are more likely to cascade into larger moves. Traders cannot rely on policy support to catch falling markets, fundamentally changing the risk calculus for equity portfolios.
Mega-cap Leadership Deteriorating
The weakness extends across the "Magnificent Seven" mega-cap technology leaders that have driven market gains throughout the current cycle. Broadcom and other major tech names are showing precarious technical setups, and without their leadership, the foundation of the broader market is crumbling. The Nasdaq futures, heavily weighted toward these technology giants, are sitting atop critical support near the 22,275 level. A violation of this support level would likely trigger a 12 percent decline toward 20,000.
This concentration risk in just a handful of mega-cap names means that any breakdown in these leaders will have outsized impact on broader market indices. When the stocks carrying the heaviest index weight lose momentum, the entire market struggles to maintain its uptrend.
Key Technical Levels For Traders
The 6,737 to 6,790 zone represents genuine structural support that demands respect from all traders. On the upside, 6,826 and 6,853 represent key resistance levels. Above 6,760, bulls can target the 200-day moving average and higher resistance. Below 6,666, accelerated selling toward 6,578 and potentially lower becomes likely. The battle for control in the near term revolves around whether buyers can stabilize price action above 6,666 or whether sellers force acceptance below that critical level.
Actionable Takeaways For Traders
Respect technical levels and wait for confirmed closes rather than reacting to intraday volatility. Position sizing becomes more critical when technical patterns suggest larger potential moves. Risk management trumps profit maximization when facing potential breakdown scenarios. Monitor oil prices and Fed expectations alongside price action, as these macro factors are amplifying technical weakness. Watch the Magnificent Seven stocks closely, as their leadership remains essential to sustaining any market recovery.