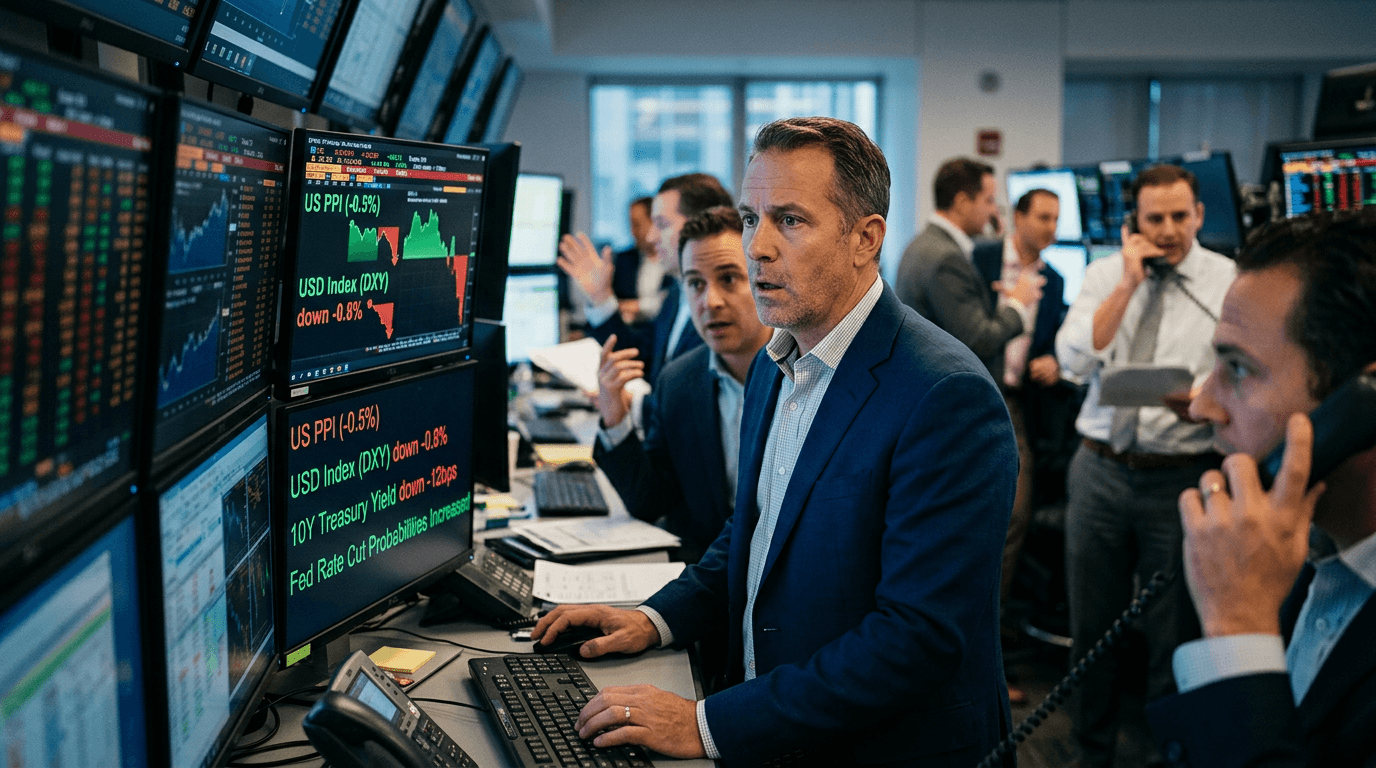
US producer prices delivered an unexpected downside surprise in March, reigniting hopes that inflation is back on a cooling path and pushing traders to rethink the Federal Reserve’s next move. The softer data knocked Treasury yields lower, weighed on the US Dollar, and gave a lift to EUR/USD, GBP/USD, gold, and interest-rate futures as markets modestly pulled forward expectations for rate cuts.
What The Latest Ppi Data Shows
The Producer Price Index (PPI) tracks price changes that businesses receive for their goods and services. It captures inflation pressures earlier in the pipeline than consumer-focused gauges like CPI or the Fed’s preferred PCE index.
In March, headline PPI fell 0.4% month-on-month, a sharp contrast to the consensus expectation for a 0.2% increase. Core PPI, which strips out volatile food and energy components, also undershot forecasts. On a year-on-year basis, producer price inflation slowed, signaling that pricing power at the factory and wholesale level is easing.
A few points matter for traders
- The surprise is more important than the absolute level. Markets were positioned for another modest increase; getting a negative print forced a rapid repricing of inflation and policy expectations.
- The decline was broad-based. While details will vary, a weaker core print typically indicates more than just a temporary drop in energy prices. Lower readings in categories like core goods and some services suggest softer underlying cost pressures.
- Volatility in PPI is common. As past data have shown, PPI can swing from hotter-than-expected to cooler-than-expected month to month. Traders should treat this as one data point in a broader trend, not a definitive turning point on its own.
Why Producer Prices Matter For The Fed
The Fed’s formal inflation target is based on PCE, not PPI. Still, PPI is a useful leading indicator because producer costs ultimately feed into consumer prices. If firms see their input costs stabilizing or falling, they have less incentive to push through aggressive price increases to end consumers.
For a central bank that has spent years battling elevated inflation, a downside shock in PPI matters in several ways:
- It reduces the risk that inflation will reaccelerate from the production side, especially if it follows earlier signs of cooling wage growth or softer demand.
- It supports the narrative that previous rate hikes are working their way through the economy, compressing margins and dampening price-setting behavior.
- It provides cover for a more dovish tilt in communication, even if the Fed does not immediately change rates.
Interest-rate futures quickly reflected this shift. Traders nudged up the probability of earlier and potentially more aggressive rate cuts, dragging implied policy rates slightly lower across the curve. That does not mean the Fed will rush into easing based on a single PPI print, but it does change the balance of risks: the bar for additional hikes grows even higher, while the threshold for cuts looks a bit closer.
Market Reaction: Dollar, Treasuries, And Gold
The immediate market reaction followed a classic “soft inflation” playbook.
US Treasury yields moved lower across the curve as traders priced in a less restrictive Fed path. Lower yields reduce the return advantage of dollar assets relative to other major economies, putting downward pressure on the US Dollar Index.
In FX, this translated into intraday strength for major dollar pairs. EUR/USD and GBP/USD both pushed higher as rate differentials became less supportive for the greenback. For euro and sterling traders, the story is less about Europe or the UK suddenly improving and more about a marginal shift against the dollar.
Gold also benefited. The metal tends to respond positively to lower real yields and expectations of easier monetary policy. When markets perceive that the Fed is closer to cutting rates, the opportunity cost of holding non-yielding assets like gold falls, and demand often increases.
In derivatives markets, interest-rate futures and swap contracts repriced to reflect slightly earlier policy easing. For short-term traders, these contracts can offer a cleaner way to express views on the Fed than spot FX or longer-dated bonds, though they require a solid understanding of contract specifications and margin dynamics.
What Traders Should Watch Next
Despite the significance of the surprise, PPI alone will not decide the Fed’s next move. The market narrative now hinges on whether this softer read is confirmed or contradicted by upcoming data.
Key releases to watch include
- Consumer Price Index (CPI): If CPI also comes in softer than expected, it will reinforce the idea that disinflation is regaining traction. A hot CPI, by contrast, would quickly unwind much of the PPI-driven optimism.
- PCE inflation: As the Fed’s preferred measure, any downside surprise here would carry more weight than PPI. Traders will focus on core PCE and super-core services to gauge persistent pressures.
- Labor market data: Payrolls, unemployment, and wage growth will shape how comfortable the Fed feels about easing. A cooling labor market plus softer producer prices is a much stronger case for cuts than PPI alone.
- Fed communication: Speeches and meeting minutes will reveal whether policymakers view the PPI miss as noise or as evidence that inflation risks are fading.
For traders, the main risk is overreacting to a single data point. The PPI shock can trigger sharp intraday moves, but the lasting trend will depend on whether subsequent data align with this disinflation narrative.
Practical Takeaways For Simulated Traders
For traders using simulated environments to build and test strategies, this PPI surprise offers a valuable case study in macro-driven market behavior.
Consider a few practical angles
- Scenario building: Create scenarios with different inflation paths—one where PPI marks the start of renewed disinflation, and another where it’s a temporary dip. Test how FX majors, gold, and equity indices behave under each scenario.
- Dollar trend analysis: Study how EUR/USD and GBP/USD reacted not only on the release day but in the days following. Did the moves hold, extend, or fade? This helps evaluate whether it’s better to trade the initial spike or wait for a pullback.
- Cross-asset relationships: Examine how changes in Treasury yields align with moves in gold and stock indices. Understanding these correlations can help design more robust strategies that don’t rely on a single market.
- Risk management: Volatility around data releases can be both an opportunity and a hazard. Use simulated trading to practice position sizing, setting stop-losses, and managing slippage during high-impact events.
Ultimately, the March PPI report is another reminder that macro data can quickly reshape the trading landscape. A single negative print will not determine the full policy trajectory, but it has been enough to nudge markets toward a more dovish Fed outlook, weaken the dollar, and reawaken interest in rate-sensitive assets. Traders who understand how these pieces connect—and who practice executing around such events—will be better positioned when the next surprise hits.