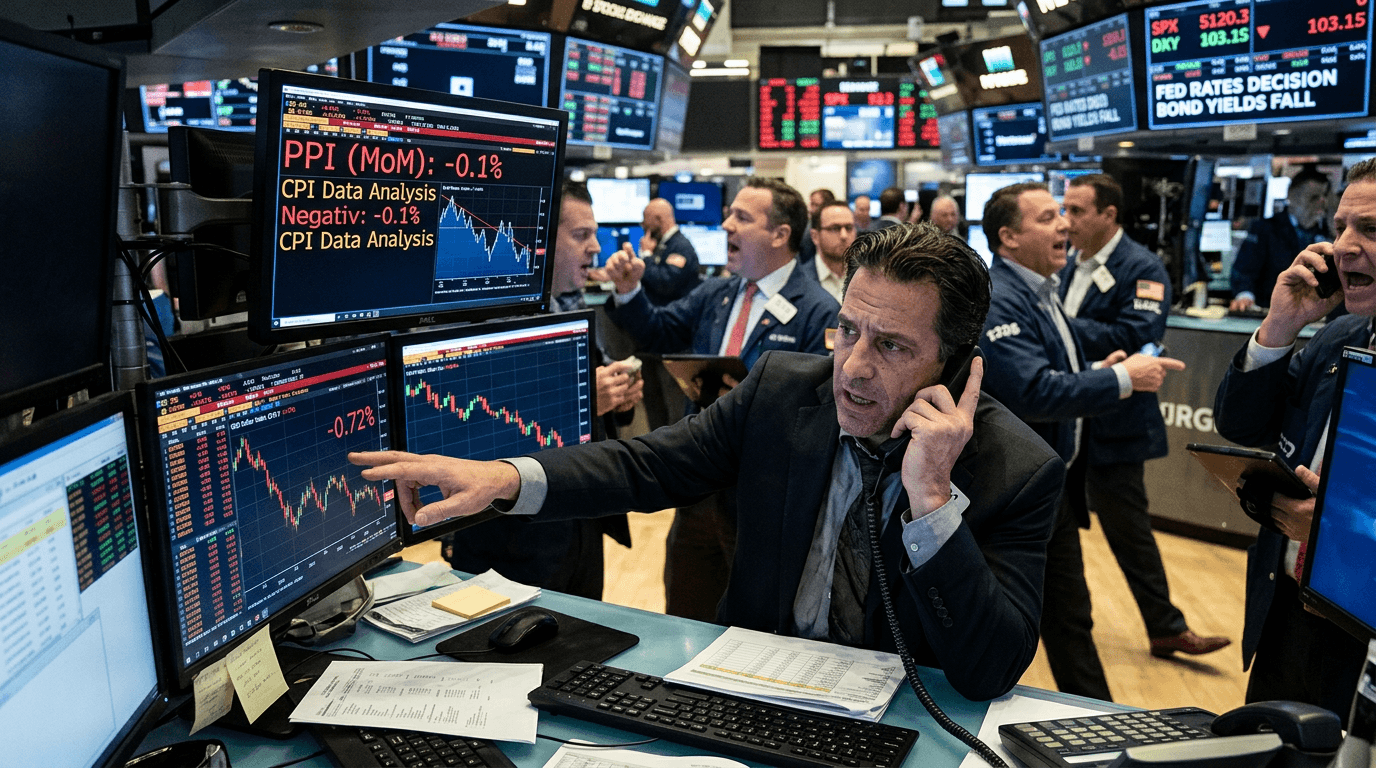
US producer prices have just delivered a genuine curveball to markets: both headline and core PPI fell on the month, sharply undercutting expectations and briefly knocking the US dollar lower. For a market that had grown increasingly comfortable with a “higher for longer” Federal Reserve, a negative PPI print is a reminder that the disinflation story is not dead – and that the path for policy and the dollar is more fragile than it looked just a few days ago.
WHAT PPI IS – AND WHY THIS PRINT MATTERS
The Producer Price Index (PPI) tracks the average change over time in the prices received by domestic producers for their output, essentially measuring inflation pressures at the wholesale or “factory gate” level.[5] Because producers often adjust prices before they filter through to consumers, PPI is watched as an upstream signal for future moves in CPI and broader inflation trends.[5]
In this latest release, headline PPI fell by -0.4% month-on-month and core PPI (excluding food and energy) dipped -0.1% m/m, both significantly below consensus and prior readings. That is not just softer inflation – it is outright contraction in producer prices on the month, which is rare in an environment where markets have been preoccupied with sticky services inflation and re-accelerating costs elsewhere.
The key takeaway is that one data point does not rewrite the entire inflation narrative, but it does punch a hole in the idea that price pressures are uniformly re-accelerating. For traders, the surprise matters less because of the absolute numbers and more because it challenges prevailing positioning and expectations for the Fed.
HOW A WEAKER PPI CHALLENGES THE FED’S HAWKISH PATH
In recent months, Fed officials have leaned into a cautious, arguably hawkish stance, emphasizing the need for “greater confidence” that inflation is moving sustainably back to 2% before cutting rates. Stronger data earlier in the year, particularly in services and wages, had pushed markets to scale back aggressive rate-cut bets and even flirt with the idea of additional hikes.
A negative PPI print cuts against that backdrop. If producer prices are contracting, it suggests margin pressure on firms and weaker cost-push inflation going forward, especially in goods sectors. Historically, PPI downside surprises have been cited as easing inflationary pressures and strengthening the case for rate cuts, often coinciding with lower Treasury yields and firmer risk sentiment.[1]
This does not mean the Fed will suddenly pivot dovish based on one report. Policymakers prioritize a broad set of indicators, with core PCE and labor market data carrying more weight than PPI alone. But when an important price indicator moves decisively against the hawkish narrative, it undermines the certainty around “higher for longer” and makes the path for future decisions more data-dependent and finely balanced.
For traders, the practical implication is that the Fed reaction function becomes more two-sided again. Future CPI, PCE, and labor releases will either confirm that this PPI was an outlier or signal a more durable turn back toward disinflation – and rate expectations, yields, and FX will move accordingly.
Market Reaction: Usd, Yields, And Key Fx Pairs
The immediate market response followed a familiar pattern for disinflationary surprises. US Treasury yields dropped as traders marked down the probability of additional hikes and tentatively brought forward the timing of potential rate cuts, similar to prior episodes where softer PPI data eased policy expectations.[1] Rate-sensitive parts of the curve, such as 2-year yields, tend to react first and most sharply.
The US dollar weakened intraday as lower yields reduced the currency’s rate advantage against its peers. Pairs most sensitive to relative US rate expectations – notably EUR/USD, GBP/USD, and USD/JPY – all reflected this shift. EUR/USD and GBP/USD typically find support when US yields and the dollar retreat, while USD/JPY, which has been heavily driven by yield differentials, often comes under pressure when US rates move lower.
Equity index futures and rate-sensitive growth sectors generally welcome softer inflation data, as lower discount rates support valuations and reduce the risk of an aggressive Fed. Earlier PPI-driven disinflation surprises have coincided with gains in equity futures and tech-heavy indices.[1] This time, the reaction was similar: risk assets initially found support as the market repriced the path of policy a touch more dovishly.
However, the key nuance is that the move in USD and yields was intraday and somewhat contained. That tells you markets are not ready to abandon the idea of lingering inflation risk on the basis of one print. Instead, they are adjusting from a one-way hawkish bet toward a more balanced, tactical stance.
How Traders Can Use This: Practical Takeaways
For discretionary traders and systematic strategies alike, the message is less about this specific PPI release and more about how to trade surprises around inflation data.
First, know the expectations. Markets react to the surprise versus consensus, not the absolute level. Here, the shock came from PPI and core PPI turning negative when a modest positive was expected – that magnitude of deviation is what drove the intraday moves in USD and yields.
Second, understand which assets are most sensitive. FX pairs like EUR/USD, GBP/USD, and USD/JPY, front-end Treasury yields, interest-rate futures, and equity index futures tend to move first and strongest on inflation surprises. These are the instruments to watch – or to focus on in simulated strategies – when timing trades around macro releases.
Third, treat the first move as a starting point, not the whole story. A soft PPI can trigger knee-jerk selling of the dollar and buying of risk, but whether those moves extend or fade depends on the broader macro context: upcoming data, Fed communication, positioning, and technical levels. Trading plans should account for the possibility of retracements once the initial shock is digested.
In a SimFi environment, this type of event is ideal for building and testing rule-based playbooks: for example, strategies that respond to inflation surprises above a certain threshold, or that differentiate between goods-driven and services-driven inflation shocks. Because you are not risking real capital, you can experiment with how quickly to enter, where to place stops, and how long to hold post-release positions.
BIG PICTURE: IS DISINFLATION BACK OR JUST TAKING A TURN?
The broader question is whether this PPI contraction marks the resumption of a disinflation trend, or simply a temporary pullback in what remains a bumpy inflation normalization process. Single data points rarely give a definitive answer.
PPI can be volatile month to month, especially in components tied to energy, trade margins, and transportation costs.[5] It is entirely possible for producer prices to dip one month and rebound the next, particularly in a world still adjusting to shifting supply chains and periodic commodity shocks. That is why central banks emphasize the “totality of data” and medium-term trends rather than one-off surprises.
For now, the main impact of this report is psychological and tactical. It reminds markets that upside inflation surprises are not the only risk, that the Fed’s path is not locked in, and that the dollar’s strength is contingent on the continuation of the higher-for-longer narrative. If upcoming CPI, PCE, and wage data echo this softer signal, the case for earlier and more substantial Fed easing would gain traction, with deeper implications for global FX, rates, and equity markets.
Until then, traders should treat this PPI shock as a valuable stress test of positions and assumptions. It highlights the importance of staying flexible, monitoring cross-asset reactions, and having a clear framework for how macro surprises feed into pricing – whether in live markets or in a simulated trading environment designed to sharpen that edge.