Fibonacci Retracement in Forex: How to Use It for Entry and Exit Points
Entering and exiting trades without tools means you’re relying on guesswork. That’s a risky way to trade and it often leads to losses. Rather, you should make informed decisions by using Fibonacci retracement. It is a simple tool that helps you identify where the price might reverse or take a break. It gives you a clear plan for when to buy or sell. Instead of hoping for the best, you will have a strategy based on proven price patterns. E8 Markets will show you how to use Fibonacci retracement in Forex and logic to your trading decisions without needing complex analysis.
What is Fibonacci Retracement?
Fibonacci retracement is a tool that helps you predict where the price of a currency might slow down or change direction during a trend. It’s based on something called the Fibonacci sequence. Simply put, it is a series of numbers discovered by an Italian mathematician named Leonardo Fibonacci in the 13th century. In this sequence, each number is the sum of the two before it: 0, 1, 1, 2, 3, 5, 8, and so on.
While the math might sound complicated, you don’t need to calculate anything yourself. The important part is how this sequence creates ratios, which are found in seashells, flowers, and everywhere in nature. They are found in financial markets, too! These ratios help you identify key price levels where trends often pause or reverse.
Common Retracement Levels
Fibonacci retracement strategy focuses on five key levels: 23.6%, 38.2%, 50%, 61.8%, and 78.6%. These levels are percentages of the total price movement between two points (a high and a low in the market). You use these levels to predict areas where the price might pause, reverse, or continue its trend.
Each level represents a potential zone where the market could react. For example, the 23.6% level often shows minor pullbacks in strong trends, while the 61.8% level, also called the “golden ratio,” is where prices frequently reverse sharply. The 78.6% level indicates a deep retracement, often signaling a potential trend reversal. Why do these levels matter? They matter because you should observe price actions at these levels to confirm whether the price is likely to react.
How Fibonacci Retracement Strategy Works in Forex Trading
To understand how the Fibonacci Forex strategy works, you first need to know how market trends behave. In Forex trading, prices don’t move in straight lines. Even in a strong uptrend or downtrend, the price will often pull back temporarily before continuing in the same direction. These pullbacks are where you need the Fibonacci trading strategy. When you draw the levels of Fibonacci retracements in Forex, they show potential support or resistance areas. For example:
- In an uptrend, retracement levels help you find where the price might stop falling and start rising again.
- In a downtrend, retracement levels help you identify where the price might stop rising and start falling again.
By using Fibonacci levels like 23.6%, 38.2%, 50%, and 61.8%, you can spot points where the price is likely to bounce or reverse. These levels aren’t random—they are based on the natural rhythm of the market.
The Psychology Behind Fibonacci Levels
Why do Fibonacci levels work? A big reason is trader psychology. Many traders around the world use the Fibonacci retracement Forex strategy, which creates a self-fulfilling effect. When enough traders expect the price to react at these levels, they often act by placing buy or sell orders there. This behavior increases the chances that the price will actually bounce or reverse at these points.
For example, at the 61.8% level, many traders might place buy orders if they think the price will bounce back up in an uptrend. This increased buying pressure often pushes the price back up. Similarly, in a downtrend, traders might place sell orders at Fibonacci levels, reinforcing the trend.

How to Draw Fibonacci Retracement Levels
Using the Fibonacci retracement Forex strategy is simple. You can do it just a few steps. First, you identify the trend. Then you find key price points and use the Fibonacci Forex tool, which is available on the trading platform.
Step 1: Identify the Trend
Before drawing Fibonacci retracement levels, determine if the market is in an uptrend or a downtrend. An uptrend occurs when the price is consistently making higher highs and higher lows. On the other hand, a downtrend occurs when the price is making lower highs and lower lows.
Step 2: Select the Swing High and Swing Low Points
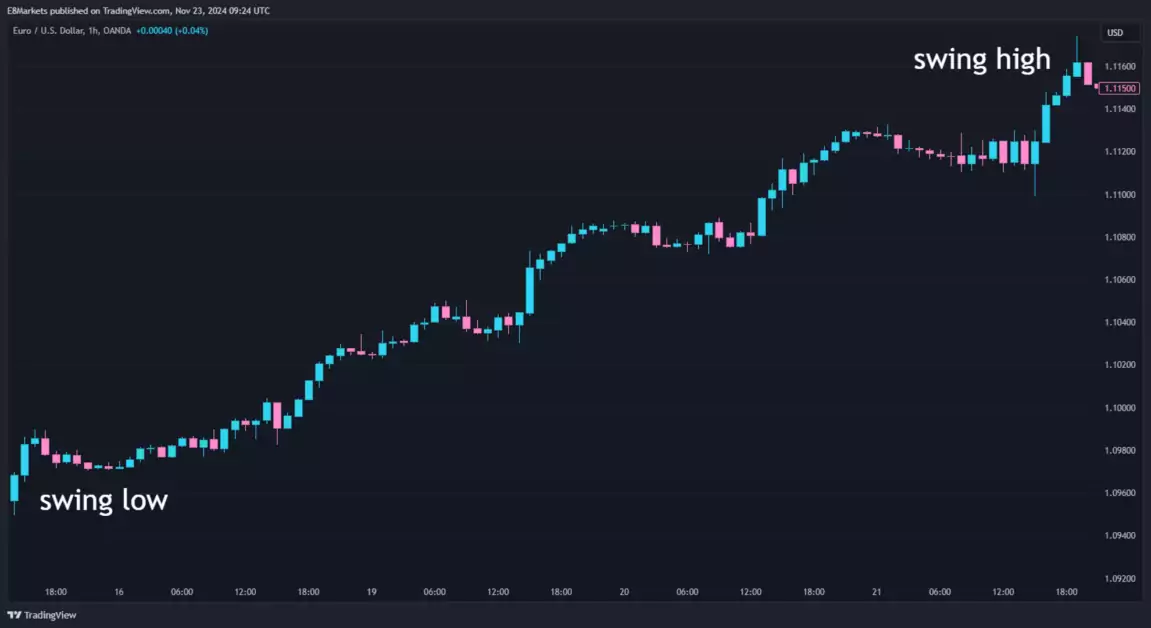
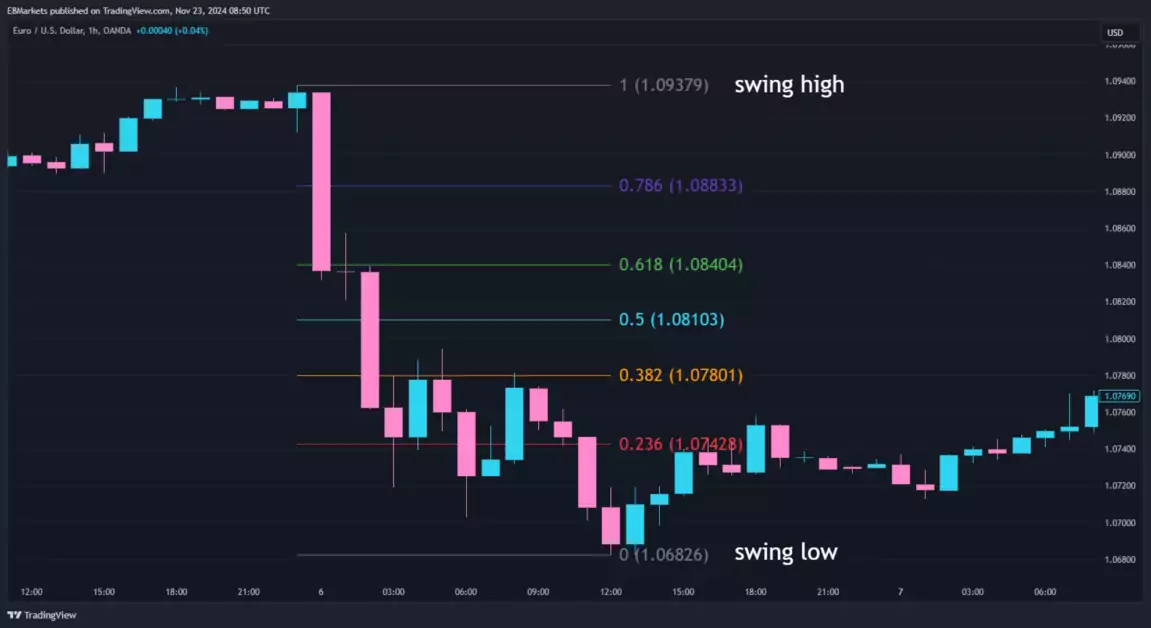
Swing high and swing low are the points where the price reverses direction temporarily. In an uptrend, the swing low is the starting point of the upward move, and the swing high is the highest point before the price begins to pull back. In a downtrend, the swing high is the starting point of the downward move, and the swing low is the lowest point before the price starts to retrace upward.
Step 3: Plot the Fibonacci Tool on Your Trading Platform
Now, you are ready to plot the Fibonacci tool. Here is how:
- Open your chart and locate the Fibonacci tool (usually in the drawing tools section).
- Click on the swing low (for an uptrend) or swing high (for a downtrend).
- Drag the tool to the swing high (for an uptrend) or swing low (for a downtrend).
- The Fibonacci levels (23.6%, 38.2%, 50%, 61.8%, 78.6%) will automatically appear on the chart.
Example: Uptrend
Imagine the price of EUR/USD starts at 1.1000 (swing low) and rises to 1.1200 (swing high). The Fibonacci retracement levels will be calculated as percentages of this 200-pip move:
- 23.6%: 1.1152
- 38.2%: 1.1124
- 50%: 1.1100
- 61.8%: 1.1076
These levels show where the price might pull back before continuing the uptrend.
Example: Downtrend
If the price starts at 1.1200 (swing high) and falls to 1.1000 (swing low), the Fibonacci retracement levels will highlight potential resistance areas during a pullback:
- 23.6%: 1.1048
- 38.2%: 1.1076
- 50%: 1.1100
- 61.8%: 1.1124
These levels show where the price might reverse downward after a temporary rise.

Interpreting Fibonacci Retracement Levels
First, you need to know about support and resistance zones. In an uptrend, Fibonacci levels often act as support. This means the price may stop falling at these levels and start moving upward again. In a downtrend, these levels act as resistance, where the price might stop rising and turn downward.
The Significance of Each Level
The levels represent percentages of the total price movement between two points (a high and a low in the market) and show potential areas where the price might pause, reverse, or consolidate. Let’s explore what each level means and why it matters:
- 23.6% (minor correction) – This level represents a shallow pullback. It’s common in strong trends where the price doesn’t need much of a correction before continuing in the same direction. While it shows minimal interruption in the trend, it’s less reliable for predicting major reversals.
- 38.2% and 50% (common retracement zones) – These levels are the most frequent zones where the price stabilizes or reverses temporarily. Traders often use these levels to find potential entry points during a trend. When the price pauses at these levels, it gives you time to analyze and plan your next move.
- 61.8% (the golden ratio) – This is one of the most significant levels and is often called the “golden ratio.” Prices tend to show strong reactions here, making it a popular level for identifying reversals or trend continuation. It’s highly regarded because it aligns with both market psychology and historical price behavior.
- 78.6% (deep retracement) – This level indicates a deeper pullback and often suggests the trend might be weakening. If the price reaches this level, it’s a signal to watch for potential trend reversals or larger market shifts.
Using Fibonacci Retracement in Forex for Stop-Loss and Take-Profit
In an uptrend, place your stop-loss order just below the lowest Fibonacci level or the swing low. This protects your trade if the price breaks through the support. In a downtrend, place the stop-loss above the highest Fibonacci level or the swing high to guard against unexpected price moves.
You can also use Fibonacci levels for take-profit placement. Use Fibonacci extension levels (such as 127.2% or 161.8%) to identify where the price might go after resuming the trend. These levels help you predict how far the market could move, allowing you to plan exits in advance. Alternatively, take partial profits at retracement levels like 38.2% or 50% and let the rest of your trade continue.
A Practical Example
Let’s say the market is in an uptrend. The price pulls back to the 50% retracement level and starts bouncing. This could be a signal to enter a buy trade. You might place your stop-loss just below the 61.8% level to minimize and manage risk. To take a profit, you could set your target at the 127.2% Fibonacci extension level, anticipating where the trend might continue.
Combining Fibonacci Retracement with Other Tools
Fibonacci retracement Forex strategy is powerful, but using it on its own can sometimes lead to false signals. Market conditions are influenced by multiple factors, and relying solely on Fibonacci levels might cause you to misjudge potential reversals or continuations. This is why you need to combine Fibonacci retracement with other tools. This way, you get a clearer picture of what’s happening in the market. These tools validate whether a price level is likely to hold or break and give you more confidence in your trades.
Here are some technical indicators that complement Fibonacci Forex retracement effectively:
- Moving averages: Moving averages help you confirm the overall trend. For example, if a Fibonacci retracement level aligns with a moving average, it adds strength to the level as support or resistance. A rising moving average in an uptrend, combined with a pullback to the 50% Fibonacci level, signals a likely continuation of the trend.
- RSI (Relative Strength Index): RSI measures whether the market is overbought or oversold. If the RSI shows oversold conditions near a Fibonacci retracement level in an uptrend, it increases the likelihood of a bounce. Similarly, in a downtrend, overbought RSI near a retracement level suggests a potential reversal.
- MACD (Moving Average Convergence Divergence): MACD helps you gauge market momentum. If the MACD histogram or signal line indicates increasing momentum near a Fibonacci retracement level, it confirms that the price might react at that level. For instance, a bullish MACD crossover near the 61.8% level supports a potential upward move.
- Trendlines: Trendlines are simple but effective tools for validating trends. If a Fibonacci retracement level aligns with a rising trendline in an uptrend, it strengthens the likelihood of a bounce. Similarly, a descending trendline in a downtrend adds confidence to a Fibonacci resistance level.
- Candlestick patterns: Candlestick patterns, like pin bars or engulfing candles, provide visual clues about price reversals. If a bullish engulfing candle forms near the 38.2% retracement level in an uptrend, it’s a strong signal to consider entering a buy trade.
How These Tools Complement Fibonacci Retracement Strategy
Each of these tools adds a unique layer of confirmation to your analysis:
- Moving averages validate the trend.
- RSI identifies whether the price is overextended and ready to reverse.
- MACD confirms the strength of the momentum.
- Trendlines highlight natural price levels where the trend might resume.
- Candlestick patterns provide direct visual evidence of price rejection or continuation.
Using Fibonacci Retracement for Entry Points
The Fibonacci Forex strategy is one of the simplest ways to find entry points. When prices are trending, they don’t move in straight lines. Instead, they tend to pull back (retrace) before continuing in the same direction. Fibonacci retracement Forex strategy helps you identify the points where these pullbacks might stop. This allows you to enter trades at more favorable levels.
In a trending market, prices often retrace to specific Fibonacci levels, like 38.2%, 50%, or 61.8%, before resuming the trend. These levels act as support in an uptrend and resistance in a downtrend. By identifying these levels, you can plan where to enter your trade rather than guessing or chasing the price.
- In an uptrend, entry points occur when the price pulls back to a Fibonacci level and shows signs of bouncing back up.
- In a downtrend, entry points happen when the price retraces upward to a Fibonacci level and starts reversing downward.
For example, if the price of EUR/USD rises from 1.1000 to 1.1200 and then starts to fall, plotting Fibonacci retracement levels on this move will show you where the pullback might end. If the price pulls back to the 50% level (1.1100) and starts moving up again, this could be a good point to enter a buy trade.
Using Confirmation for Better Accuracy
To ensure Fibonacci entry and exit points are effective, confirm that the price is likely to bounce at a Fibonacci level. Here are a few confirmation techniques you should use:
- Candlestick patterns: Look for signs of price rejection, such as a bullish pin bar (a candle with a long lower wick) forming at a Fibonacci level. This pattern shows the market is rejecting lower prices, signaling a potential upward reversal.
- Trendlines: If a Fibonacci level aligns with a rising trendline in an uptrend, it strengthens the likelihood that the price will bounce back upward. This is a simple but effective way to confirm a retracement.
- Moving averages: Moving averages, like the 50-day or 200-day, act as dynamic support or resistance. If a Fibonacci level is close to a moving average, it increases the likelihood of a bounce.
- RSI (Relative Strength Index): If the RSI indicates oversold conditions (below 30) near a Fibonacci level in an uptrend, it confirms that the price might reverse upward.
Example of Finding an Entry Point
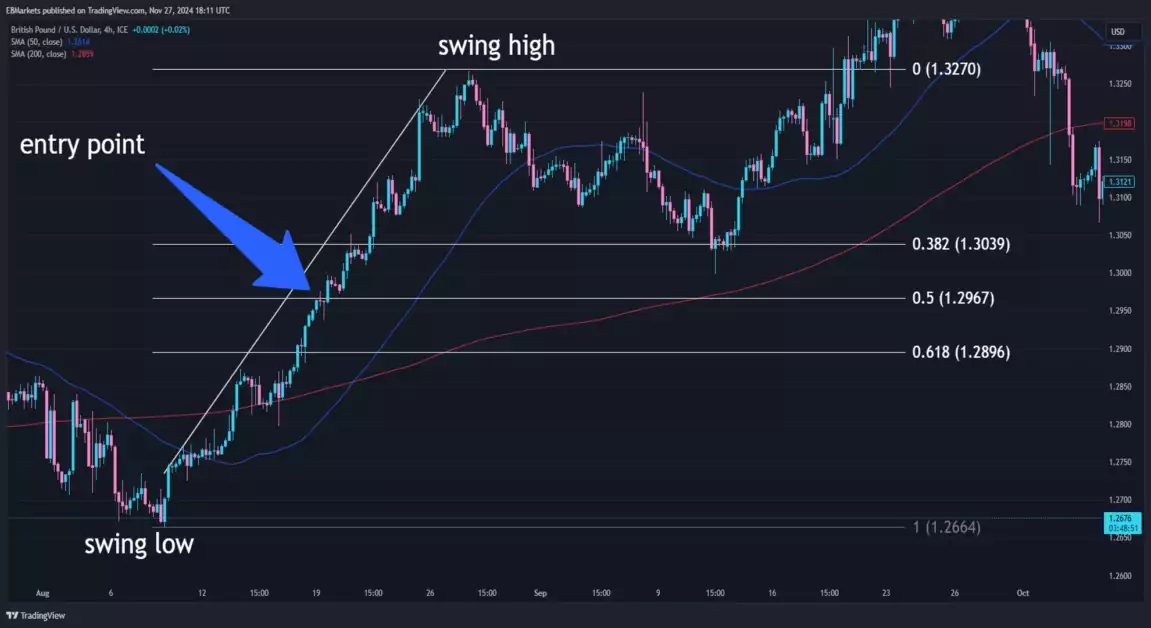
Imagine the price of GBP/USD is in an uptrend, moving from 1.266 to 1.326. After reaching 1.326, the price begins to pull back. You plot Fibonacci retracement levels on this move to identify potential support zones where the price might bounce. The 50% retracement level (1.296) aligns with both a rising trendline and the 50-period moving average, suggesting a strong support area.
The 50-period moving average acts as dynamic support at the 50% Fibonacci level, reinforcing the likelihood of a bounce. Additionally, the 50-period moving average is positioned above the 200-period moving average, confirming the uptrend’s strength and bullish momentum.
These signals make 1.296 a logical entry point for a buy trade. You could place your stop-loss just below the 61.8% level (1.290) to manage risk and set your take-profit above the swing high at a Fibonacci extension level, such as 127.2% or 161.8%, depending on market conditions.

Using Fibonacci Retracements for Exit Points
Finding the right exit points is just as important as finding good entry points. Exiting too early might leave profits on the table while exiting too late could mean giving back gains. Fibonacci extensions are levels that go beyond the range of the initial price movement you analyzed. While retracement levels help you find pullbacks for entries, extension levels predict how far the price might travel after resuming the trend. These are ideal for setting your take-profit targets.
Common Fibonacci extension levels include:
- 127.2%
- 161.8%
- 200%
- 261.8%
So, how do you find exit points? After the price retraces to a Fibonacci retracement level and resumes the trend, look for the 127.2% level as the first profit target. This is often where the price slows down or faces resistance. If the trend remains strong, the next logical target is the 161.8% level, where a larger reversal might occur. For extended trends or high momentum moves, consider 200% or 261.8% levels for additional profit-taking. The key is to plan your exits ahead of time by choosing one or more extension levels as your targets.
Using Confirmation to Strengthen Your Exit Strategy
Fibonacci extension levels work even better when combined with confirmation tools. These tools help you decide whether to exit fully, partially, or hold for higher levels:
- RSI (Relative Strength Index): Use RSI to check if the market is overbought or oversold as it approaches an extension level. For example, if the price nears the 161.8% extension level and the RSI shows overbought conditions (above 70), it’s a strong signal to exit your trade.
- MACD (Moving Average Convergence Divergence): Check the MACD histogram or signal line to confirm momentum. If momentum weakens as the price reaches the extension level, it’s a good indication to take profits.
- Support and resistance levels: Look for past support or resistance zones that align with Fibonacci extension levels. These areas often reinforce the significance of an extension level as a profit-taking point.
Example of Using Fibonacci Extensions for Exits
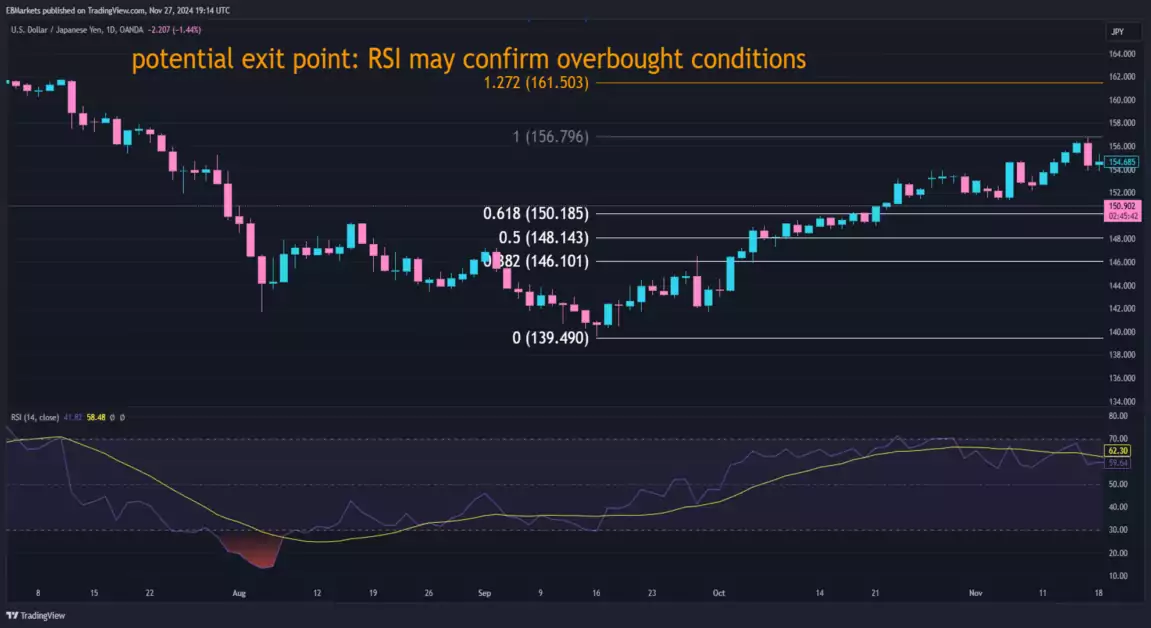
Let’s say you’re trading an uptrend in USD/JPY, and the price has reached a swing high of 156.796. You plot Fibonacci extensions to project potential exit points beyond this high. The 127.2% extension level (161.503) is identified as the first likely profit-taking zone. As the price approaches 161.503, you check the RSI, which shows the market is entering overbought territory (above 70). This suggests that the trend might lose momentum soon. With this confirmation, you decide to exit your trade at 161.503. This way, you secure profits before any potential pullback occurs.

Advantages and Limitations of Fibonacci Retracement
Like any tool, Fibonacci retracements in Forex have both strengths and weaknesses. Its advantages are:
- Simplicity and visual clarity – It is easy to use. You can plot the levels and instantly see potential areas of support and resistance with just a few clicks.
- Prediction of price levels with high probability – Fibonacci retracement is not random. Many traders use it, which makes its levels self-reinforcing. rice often reacts to these levels because they align with market psychology. This means you can use the Fibonacci trading strategy to identify areas where the price is more likely to pause or reverse.
- Versatility across markets and timeframes – You can use Fibonacci retracement in any market, whether Forex, stocks, or commodities, and on any timeframe. Whether you prefer day trading or long-term investments, Fibonacci retracement adapts to your trading style.
Fibonacci trading strategy has limitations as well:
- Subjectivity in choosing swing high/low points – Different traders might choose slightly different points, leading to variations in the levels they see. This subjectivity means that your analysis might not always align with others.
- Not foolproof without additional confirmation tools – The price doesn’t always react at these levels, especially in volatile markets or during strong trends. Without additional confirmation tools like RSI, MACD, or trendlines, relying solely on Fibonacci entry and exit points can lead to false signals and losing trades.
- Risk of over-reliance – Because Fibonacci retracements in Forex are so popular, some traders rely on it too heavily and ignore other critical factors, like news events or fundamental analysis. For example, economic data like inflation rates and average consumer prices can heavily influence market trends, potentially invalidating technical levels.
Use Fibonacci Retracement, Confirm Signals, and Trade with Precision
Using Fibonacci retracement in Forex gives you a clear framework to identify potential support and resistance levels. It helps you predict where the price might reverse or pause during a trend. It simplifies your trading decisions, provides structure, and reduces emotional guesswork. To ensure accuracy, you need to confirm price reactions with other tools like RSI, MACD, and moving averages. Also, stay aware of external factors like news events and economic shifts, which can disrupt even the most reliable technical levels. When you combine Fibonacci retracement with technical and fundamental analysis, and get broader market awareness, you will develop a disciplined and strategic approach to trading.
Trade with E8 Markets
Start our evaluation and get opportunity to start earning.Disclaimer
The information provided on this website is for informational purposes only and should not be construed as investment advice. Always conduct your own research and consult with a qualified financial advisor before making any investment decisions. We do not endorse or promote any specific investments, and any decisions you make are at your own risk. This website and its content are not responsible for any financial losses or gains you may experience.
Please consult with a legal professional to ensure this disclaimer complies with any applicable laws and regulations in your jurisdiction.


