How to Conduct a Forex Market Sentiment Analysis
The Forex market is driven by people. This means that there are human emotions, opinions, and decisions behind every trade. Traders act based on their beliefs about where prices are headed. Sometimes they’re confident and optimistic, while other times fear and uncertainty dominate. These collective feelings create what we call market sentiment. E8 Markets will explore how you can analyze market sentiment and improve your trading. You will learn how to use tools like sentiment indicators, news analysis, and even social media to figure out what traders are thinking.
What is Forex Market Sentiment Analysis?
Forex market sentiment analysis is the process of understanding the overall mood of traders in the market. When you learn how to measure sentiment, you will figure out whether most traders expect a currency to rise or fall in value. By analyzing Forex market sentiment, you get insights into the emotions and psychology of the market. Understanding market sentiment in Forex is just as important as understanding technical charts or economic reports.
Key Benefits of Market Sentiment Analysis
The Forex market is heavily influenced by crowd behavior. Forex sentiment impacts price movements because it reflects what traders believe will happen. For example, if a large number of traders expect a currency to gain value, they may buy it, which increases demand and pushes the price up. On the other hand, if traders lose confidence, selling pressure can lower the price. When you learn how to spot these trends, you will make better trading decisions.
Limitations of Solely Relying on Sentiment
While Forex sentiment analysis is helpful, it’s not enough on its own. Relying only on market sentiment can lead to mistakes. When too many traders are on the same side of the market, it can create a situation where prices reverse unexpectedly. For example, if everyone expects a price increase, there may not be enough buyers left to push the price higher.
Also, it lacks precision. Sentiment doesn’t tell you when a price will change or how far it will go. Therefore, it is best used alongside tools such as economic indicators and technical analysis for a clearer picture. In addition, there is emotional bias. Market sentiment is based on trader emotions, which can sometimes lead to irrational decisions. Following the crowd blindly can put you at risk if the sentiment changes suddenly.
Forex Market Sentiment Indicators and Tools
To analyze market sentiment effectively, you can use specific tools and indicators that show how traders feel about the market. These Forex sentiment tools provide insights into whether traders are optimistic (bullish) or pessimistic (bearish) about a currency’s future movements. The key tools you need to get familiar with are:
- Commitments of Traders (COT) Report
- Currency Strength Meters
- Retail Trader Sentiment

Commitments of Traders (COT) Report
The COT report is a weekly publication by the Commodity Futures Trading Commission (CFTC). It provides data on the positions of large institutional traders, commercial hedgers, and small retail traders in the futures market. While it doesn’t directly track the Forex market, the COT report includes data on currency futures, which can be a helpful proxy. The COT report reveals how professional traders are positioning themselves. By seeing whether large players are buying (long) or selling (short) a currency, you can gauge the overall sentiment of influential market participants.
Here is how to interpret COT data:
- Long positions: These show traders who are betting on the price increase. A rise in long positions signals bullish sentiment.
- Short positions: These represent bets on the price falling. An increase in short positions indicates a bearish sentiment.
- Net positions: Subtracting short positions from long positions gives the net position, showing whether the market leans bullish or bearish overall.
For example, if the COT report shows a sharp increase in long positions for the Euro, it might indicate strong optimism for the Euro’s future performance.
Currency Strength Meters
A currency strength meter measures the strength or weakness of a currency against a basket of other currencies. It’s a visual tool that gives you a quick overview of how a currency is performing relative to others. These meters use real-time exchange rate data to calculate how strong or weak a currency is. The tool compares the currency against others like the USD, EUR, GBP, and JPY.
Here is how to use it:
- If a currency is strong across most pairs, it shows bullish sentiment.
- If a currency is weak across the board, it indicates bearish sentiment.
For instance, if the USD is strong against the EUR, GBP, and JPY, a currency strength meter would confirm bullish sentiment for the USD. This tool is particularly useful for spotting mismatched strengths between two currencies. This helps you identify potential trading opportunities.

Retail Trader Sentiment
Retail trader sentiment shows the positioning of small, individual traders in the market. Platforms like IG Client Sentiment provide data on how many retail traders are long or short on a specific currency pair. Retail sentiment data often reflects the positions of less-experienced traders, who are more likely to make emotional decisions. As a result, this data can be used as a contrarian indicator. To use it effectively, you should know that:
- If retail traders are heavily long on a pair, it might indicate a bearish outlook because professional traders often take the opposite side.
- If retail traders are predominantly short, it might signal a bullish opportunity.
Let’s say 80% of retail traders are long on GBP/USD, and the price isn’t moving upward. This could mean that professional traders are positioning for a downward move.
Social Media Monitoring
Social media platforms are often the first places where traders share opinions, market updates, and reactions to news. To get insights into how traders feel about the market, you should monitor discussions on the platforms. X is a popular platform for Forex trading discussion. Many traders and analysts post market updates and opinions here. Look for hashtags like #Forex, #FXTrading, or specific currency pairs like #EURUSD. You should check Reddit, as well. Subreddits like r/Forex are full of discussions where traders share insights and strategies.
There are some key terms and topics you should monitor:
- Specific currency pairs (e.g., EUR/USD, USD/JPY).
- Sentiment-related phrases like “bullish,” “bearish,” or “trend reversal.”
- Reactions to economic news or events (e.g., interest rate changes, GDP reports).
Analyzing Trends and Themes
Analyzing Forex market sentiment involves identifying broader patterns and recurring themes in discussions. If traders are consistently optimistic about a currency, it indicates bullish sentiment, while widespread negativity signals bearish sentiment. For example, comments like “USD will keep gaining strength” suggest optimism, while statements like “The Euro is doomed after today’s report” reflect pessimism.
Large shifts in sentiment are particularly important. Sudden changes, often following major news events, can signal an upcoming price move. Extreme Forex sentiment—when most traders are heavily bullish or bearish—may indicate a reversal, as overcrowded trades lose momentum.
Economic News and Data Releases
Economic news and data releases heavily influence Forex market sentiment. Reports like Non-Farm Payrolls (NFP), interest rate decisions, and inflation updates shape traders’ perceptions of economic health and currency value trends. For example, a strong NFP report often boosts confidence in the U.S. dollar, which creates bullish sentiment. On the other hand, an unexpected interest rate cut may lead to bearish sentiment if it signals economic trouble.
Using News Sentiment Analysis Tools
News aggregators and sentiment analysis tools can help you interpret how traders feel after these events. Platforms like Bloomberg and Forex Factory provide quick access to market-moving headlines and reactions. Some Forex sentiment tools go a step further and analyze the tone of news articles to indicate whether sentiment is optimistic, neutral, or pessimistic. For example, a surge of positive headlines about rising GDP can confirm bullish sentiment, while widespread concerns about inflation might reflect a bearish outlook.
Market Reactions to News
Market reactions to economic news occur in two stages:
- Immediate reaction: This happens right after the news release and often reflects emotional responses. Prices may move sharply as traders react to the surprise factor in the data.
- Delayed reaction: After the initial volatility, the market takes time to digest the news. The delayed reaction often provides a clearer reflection of sentiment as traders reassess their positions.
Analyzing Price Action for Sentiment
Price action can provide valuable clues about market sentiment. By studying how prices move, you can identify patterns and trends that reveal whether traders are optimistic, pessimistic, or uncertain. To analyze price action and understand sentiment better, you need to use:
- Price patterns as sentiment indicators
- Volume and momentum analysis
- Candlestick patterns
Price Patterns as Sentiment Indicators
Certain chart patterns reflect shifts in trader confidence. For instance, a head and shoulders pattern often signals that bullish sentiment is fading. This pattern appears when the price rises, peaks, dips slightly, rises to a higher peak, and then falls below the original level, forming a “shoulder-head-shoulder” shape. When this pattern forms, it suggests that traders are losing confidence in the price’s ability to rise further, and a bearish reversal may follow.
Similarly, a double-top pattern can indicate that buying momentum is weakening. This happens when the price attempts to break a resistance level twice but fails. It suggests that traders are hesitant to keep buying at higher levels. A breakout below the support level that follows confirms a bearish shift in sentiment.
Volume and Momentum Analysis
Volume and momentum show the strength of market participation and add clarity to price movements. A price increase supported by high trading volume indicates strong bullish sentiment because it shows many traders are buying confidently. Conversely, if the price rises but the volume decreases, it suggests weak conviction among buyers, and a reversal may be likely.
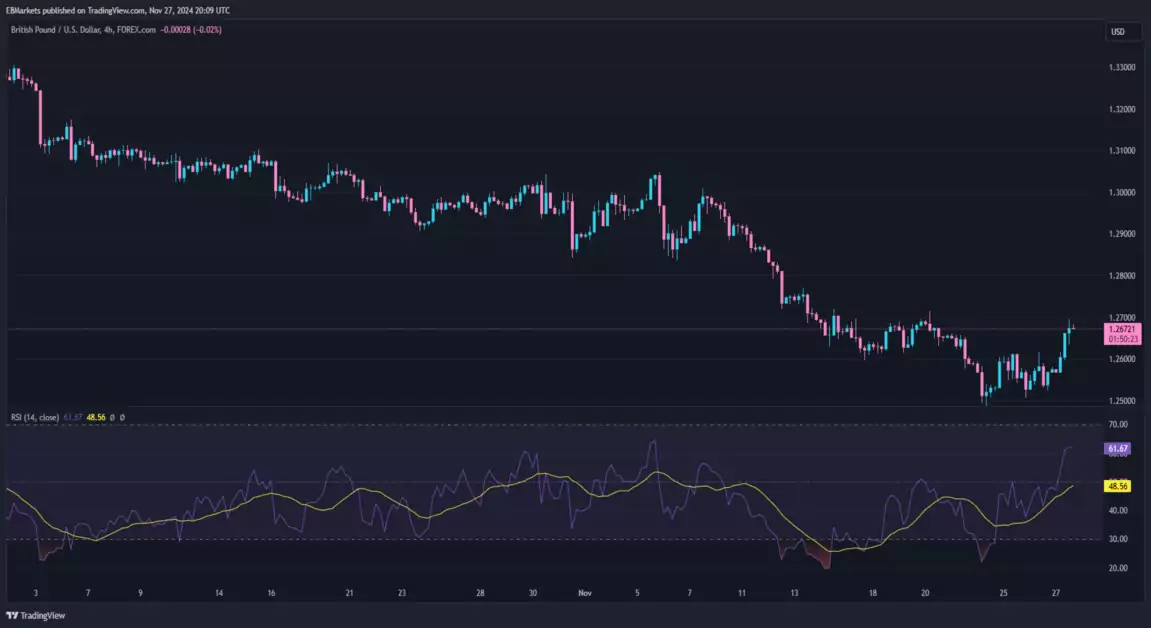
Momentum indicators like the Relative Strength Index (RSI) are particularly useful for spotting sentiment extremes. When RSI shows a value above 70, it indicates that the market is overbought—traders have been overly optimistic, and a reversal to the downside may occur. When RSI is below 30, the market is oversold, which suggests bearish sentiment might be overdone and a rebound could be on the way.
For example, imagine USD/JPY is rallying, but you notice the trading volume is declining, and RSI is above 70. This combination suggests that bullish sentiment is weakening. If the price begins to stall at a resistance level, it might be a good opportunity to plan a sell trade.

Candlestick Patterns
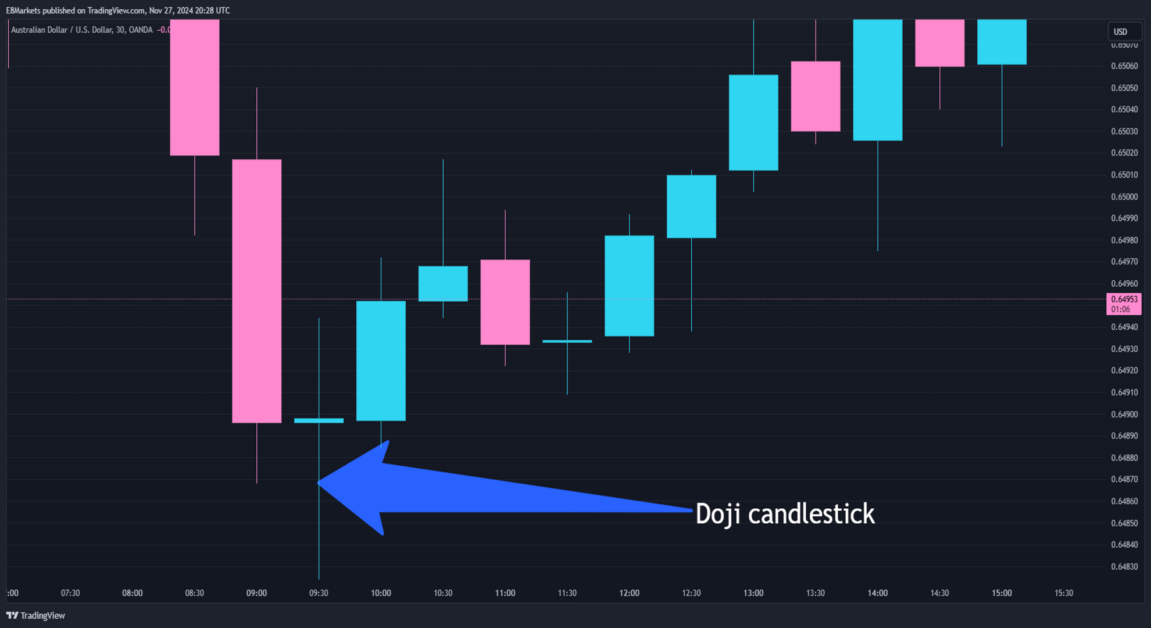
Candlestick patterns visually display trader sentiment and can signal changes in market direction. A doji candlestick, where the opening and closing prices are nearly the same, shows indecision among traders. This often appears after a strong trend and signals a possible reversal. For example, if you see a doji at the top of an uptrend, it suggests that traders are unsure about pushing the price higher, and bearish sentiment could take over.
An engulfing pattern is among key sentiment indicators. A bullish engulfing pattern forms when a larger green candlestick fully covers the previous red candlestick, signaling renewed optimism. Conversely, a bearish engulfing pattern, where a larger red candlestick covers the previous green one, reflects growing pessimism. These patterns are especially useful when they occur near key support or resistance levels.
If GBP/USD forms a doji near a major resistance level after a prolonged rally, it suggests traders are hesitant to continue buying at that price. This indecision could signal that bullish sentiment is fading, and you might consider preparing for a potential reversal.
Interpreting and Combining Market Sentiment Data
Forex market sentiment becomes much more effective when combined with other methods like technical and fundamental analysis. Think of sentiment as a piece of the puzzle rather than the complete picture. By integrating sentiment with these tools, you can develop a balanced trading strategy that helps you make more informed decisions.
- Identifying contrarian opportunities
- Using sentiment with technical analysis
- Using sentiment with fundamental analysis
Identifying Contrarian Opportunities
Contrarian opportunities occur when sentiment is overwhelmingly one-sided—either extremely bullish or bearish. These situations often signal that a price reversal is near because the market is overcrowded. For example, if sentiment data shows that 90% of traders are long (buying) EUR/USD, it’s likely that the price has little room to move higher, as most of the buying pressure has already occurred.
To take advantage of these opportunities, start by reviewing sentiment reports from brokers or platforms like IG Client Sentiment. These Forex sentiment tools provide a breakdown of how many traders are long or short on a specific currency pair. Next, combine this information with technical analysis. If you see extreme bullish sentiment near a strong resistance level—a point where upward movement often stops—it suggests a possible reversal. Similarly, bearish sentiment near a support level—a point where the price tends to bounce—may indicate an upcoming upward move.
For example, if 85% of traders are short on GBP/USD but the price is holding steady above a key support level, it might mean that bearish sentiment is overdone. You could plan a buy trade, placing your stop-loss just below the support to manage risk. Always use stop-losses to protect yourself if the market moves against you.
Using Forex Market Sentiment with Technical Analysis
Pairing sentiment with technical analysis allows you to refine your trade entries and exits. Start by identifying key support and resistance levels on your chart. These are areas where price action has historically reversed or paused. For example, you can use tools like horizontal lines or Fibonacci retracements to find these zones.
Once you’ve identified these levels, compare them to current sentiment data. If sentiment is extremely bullish, watch for the price to approach a resistance level. This combination suggests a possible reversal because traders may begin taking profits, weakening bullish momentum. Similarly, bearish sentiment paired with price near a support level could indicate a potential rebound.
To confirm these setups, use technical indicators like the Relative Strength Index (RSI) or moving averages. For instance, if sentiment is overly bullish and the RSI shows the currency is overbought (above 70), the price is more likely to reverse downward. Conversely, if sentiment is bearish and the RSI indicates oversold conditions (below 30), the price might soon bounce.
Let’s say USD/JPY is nearing a resistance level, sentiment is highly optimistic, and RSI shows overbought conditions. This alignment suggests that a reversal is likely. You might place a sell trade, targeting the next support level as your profit goal. As a beginner, practice combining these tools on a demo account to build confidence without financial risk.

Using Sentiment with Fundamental Analysis
Combining Forex sentiment with fundamental analysis helps you connect the market’s emotional reactions to actual economic data. Start by tracking key economic reports like Non-Farm Payrolls (NFP), interest rate decisions, inflation releases, and using reliable economic calendars available on trading platforms or market analysis websites.
If sentiment aligns with strong fundamentals, the market’s mood is likely justified, which makes it safer to follow the trend. For example, if sentiment is bullish for USD and strong GDP growth supports this outlook, you might look for buying opportunities in USD pairs. Conversely, when sentiment diverges from fundamentals, it can signal a contrarian trade opportunity. For instance, overly negative sentiment on EUR, despite improving European economic data, might mean the market is underestimating the currency’s strength.
Pay close attention to these divergences. If sentiment is bearish on USD but recent U.S. economic data shows rising interest rates and robust GDP growth, it could mean the market will soon shift to a bullish view. Similarly, overly bullish sentiment on EUR combined with weak European Central Bank policies might signal a downward reversal.
To understand using fundamental analysis, suppose sentiment for USD/JPY is bullish following a Federal Reserve interest rate hike. This aligns with strong fundamentals and suggests the bullish trend could continue. You could plan a buy trade near a key support level, setting a stop-loss below it to limit risk.
Practical Tips for Effective Forex Sentiment Analysis
Forex Sentiment analysis is very helpful. However, its effectiveness depends on using reliable information and avoiding common pitfalls. How to conduct a Forex market sentiment analysis more successfully? You should:
- Choose reliable sources. Use trusted platforms like IG Client Sentiment, the Commitments of Traders (COT) report, or Forex Factory for accurate data. Avoid relying on unverified social media opinions. Stick to sources that clearly explain how they calculate sentiment.
- Don’t overinterpret sentiment. Focus on extreme sentiment levels (e.g., 80% or more traders long or short). Avoid acting on small changes and always confirm sentiment shifts with technical or fundamental analysis. For example, bullish sentiment is more actionable when paired with a price breakout.
- Set alerts for key changes. Use tools like TradingView or your broker’s platform to set alerts for significant sentiment shifts. For instance, set notifications for when sentiment exceeds 80% or aligns with price nearing support or resistance. Alerts let you act quickly without constant monitoring.
Analyze Market Sentiment and Confirm it with Data to Trade Smartly
Market sentiment matters because it shows the emotional and psychological side of trading. Even the best strategies can fail if you ignore what most traders are thinking or feeling. When a large number of traders are optimistic about a currency, they will often buy, pushing the price up. When they are worried or pessimistic, selling pressure can drive prices down. By understanding market sentiment in Forex, you can spot opportunities and risks that might not be obvious from charts or economic data alone. However, to be a successful trader, you should combine sentiment with other methods like technical and fundamental analysis. By blending these approaches, you gain a more complete picture of the market, reducing risks and increasing your chances of success.
Trade with E8 Markets
Start our evaluation and get opportunity to start earning.Suggested Articles:
Disclaimer
The information provided on this website is for informational purposes only and should not be construed as investment advice. Always conduct your own research and consult with a qualified financial advisor before making any investment decisions. We do not endorse or promote any specific investments, and any decisions you make are at your own risk. This website and its content are not responsible for any financial losses or gains you may experience.
Please consult with a legal professional to ensure this disclaimer complies with any applicable laws and regulations in your jurisdiction.


