Understanding Support and Resistance Levels in Forex Trading
Succeeding and failing in trading often comes down to one thing: understanding where prices are likely to stop or turn. We call these points support and resistance levels. Support is a price level that acts like a floor that stops the price from going lower. On the other hand, resistance works like a ceiling that prevents the price from going higher. These levels are not random. They form because of how traders react to price movements over time. We at E8 Markets will show you how to find support and resistance Forex levels and how to use them to plan your trades and manage risks.
What Are Support and Resistance Levels?
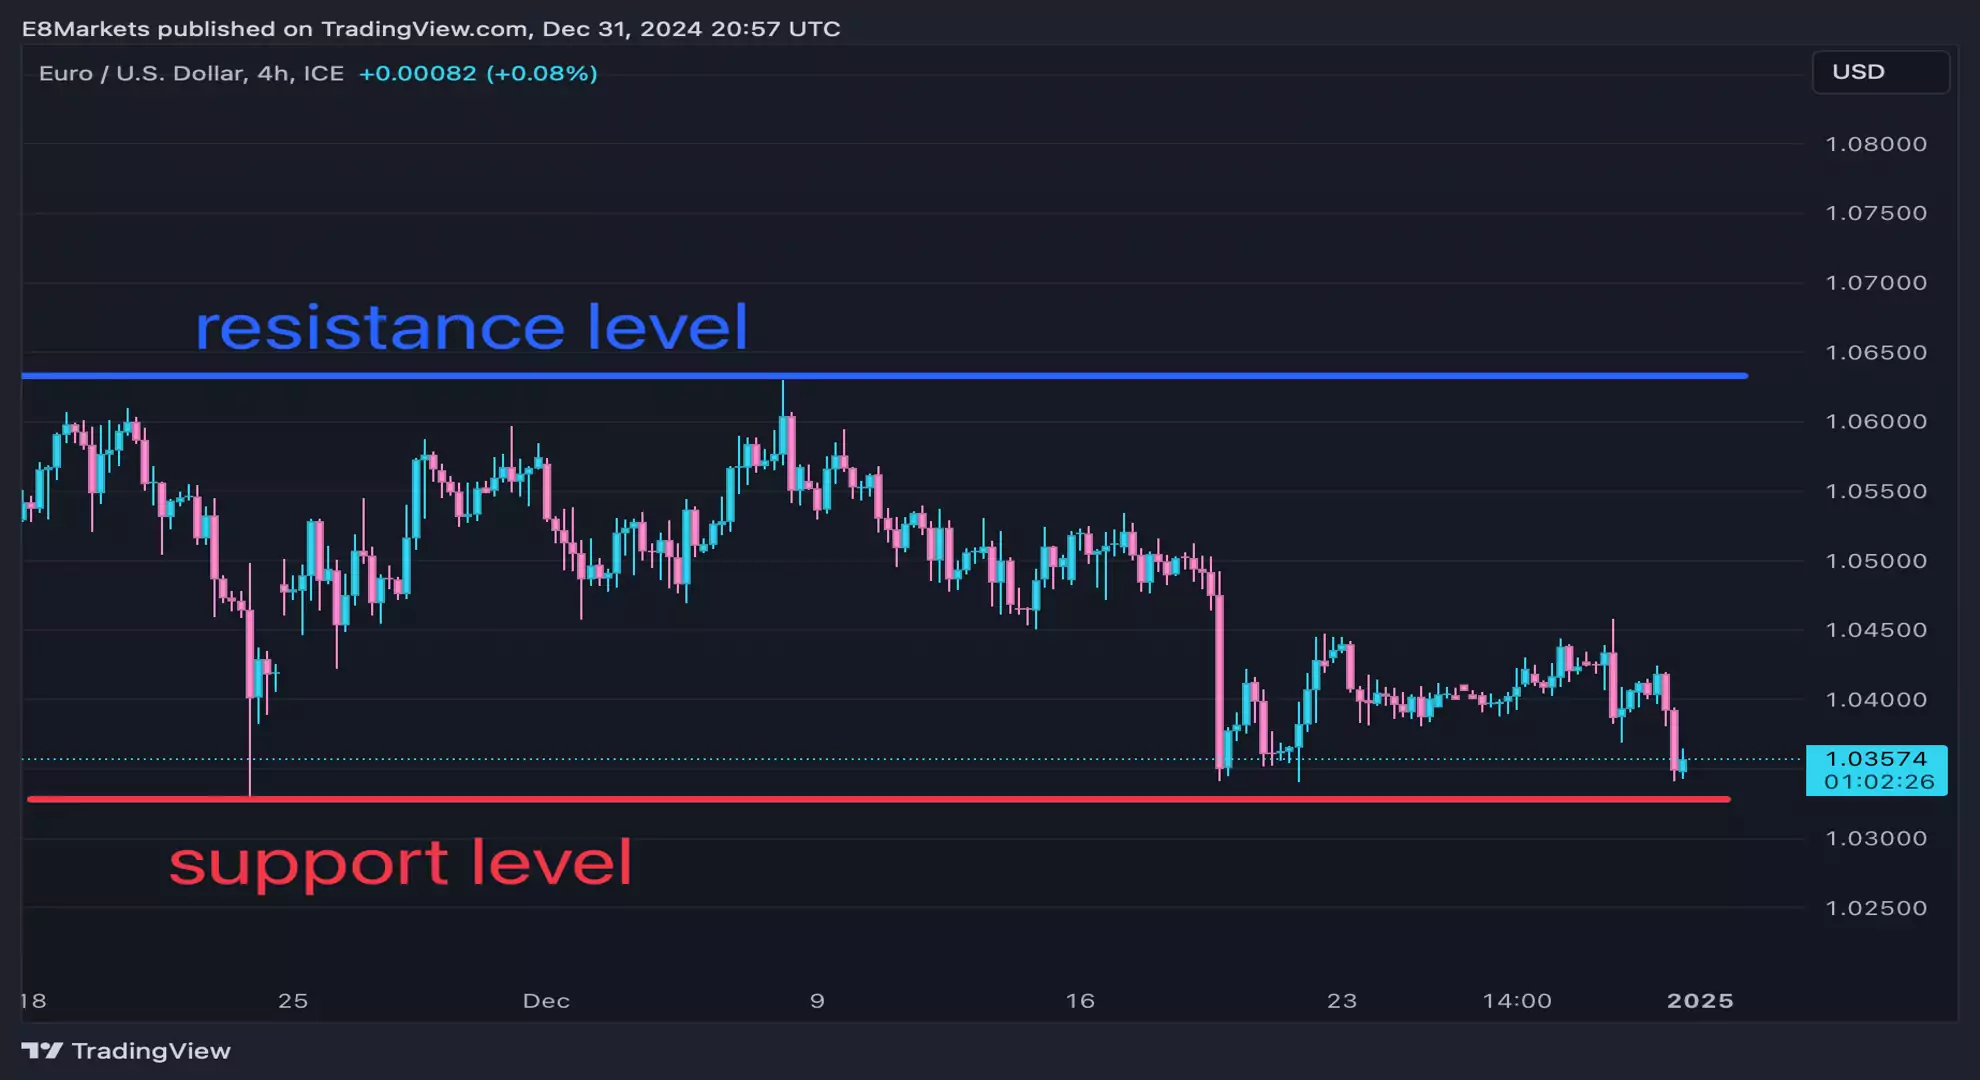
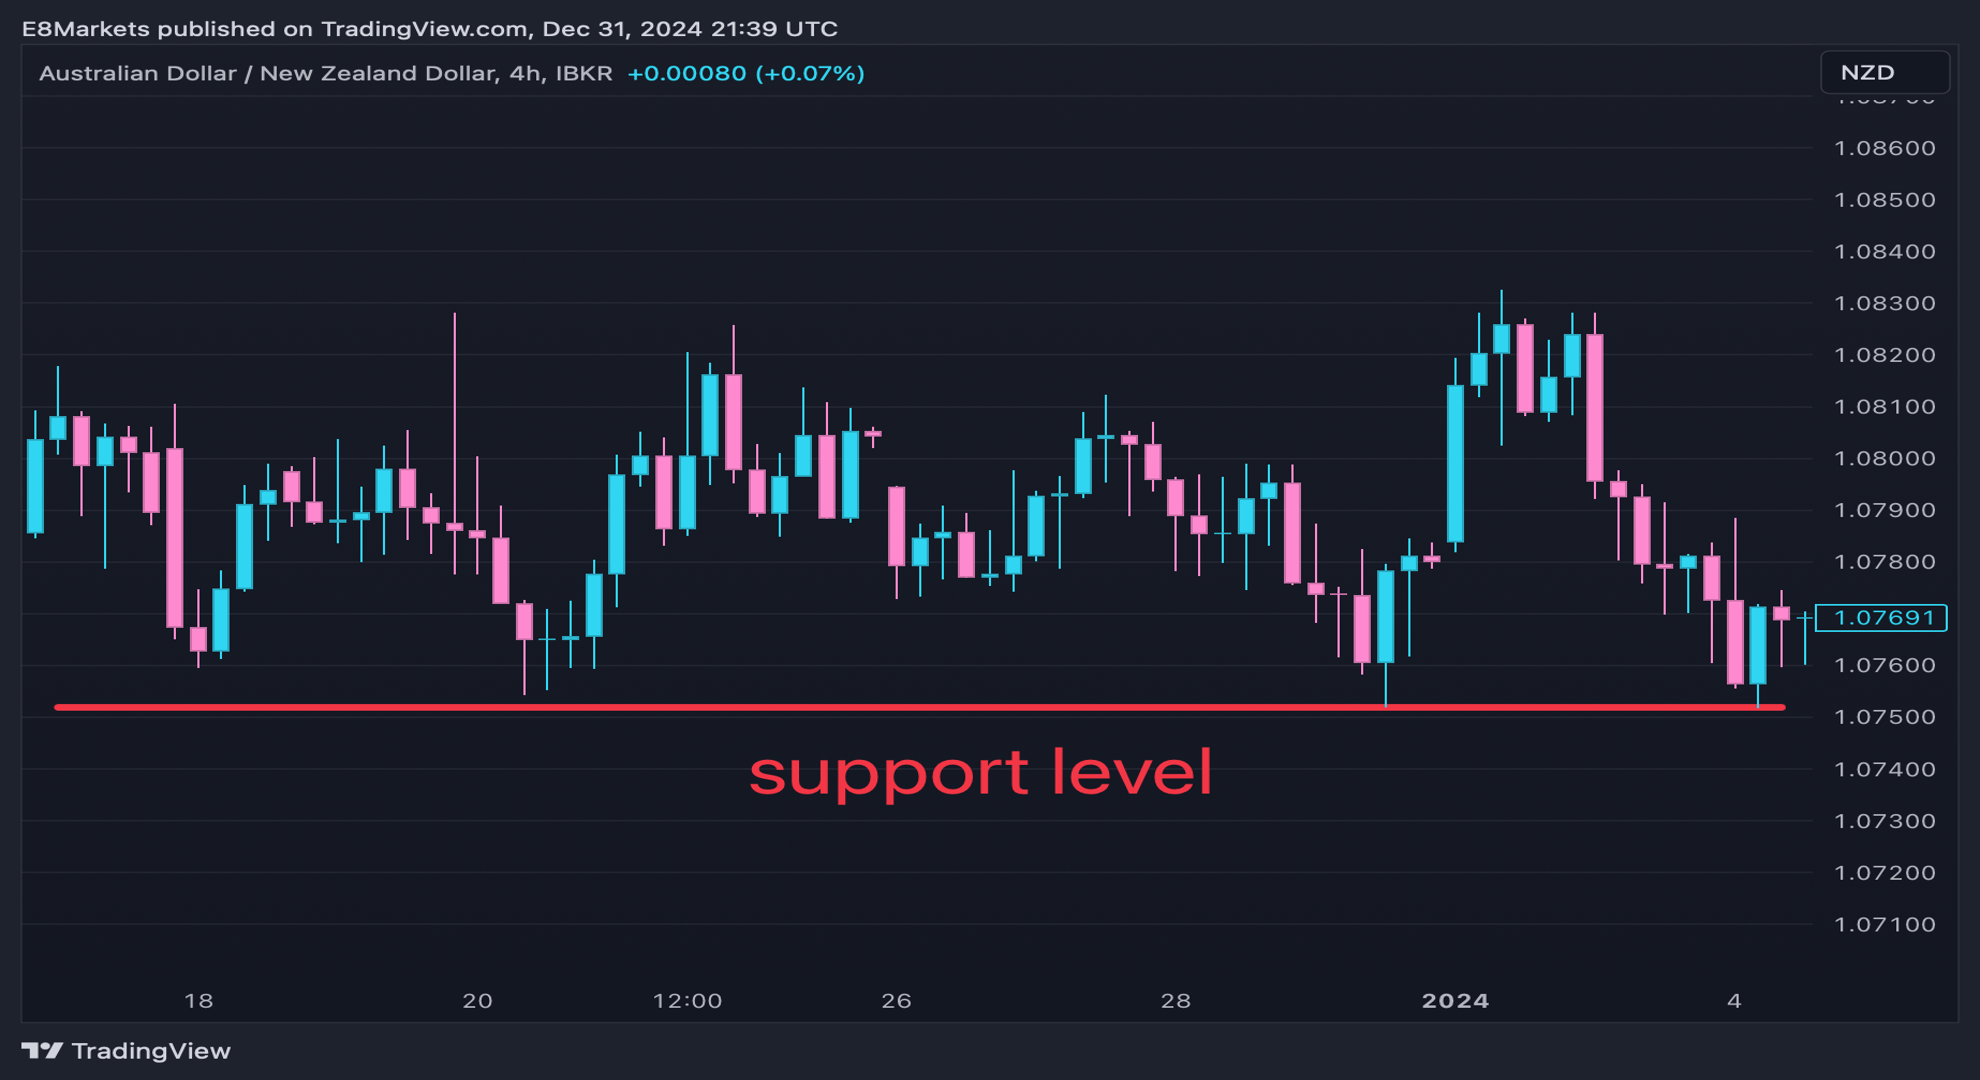
Prices don’t move in a straight line in Forex—they go up and down. Understanding support and resistance in Forex trading will help you understand where prices might stop or change direction. Support is a price level where the market tends to stop falling and bounce back up. It prevents the price from dropping further. This happens because many traders see this level as a good price to start buying, which increases demand and pushes the price higher.
Imagine EUR/USD has been dropping in value. Each time it reaches 1.0200, the price stops falling and bounces back up. This means 1.0200 is acting as a support level. Buyers are stepping in at this price, believing it is a good opportunity to buy Euros against the Dollar. If EUR/USD approaches 1.0200 again in the future, there is a chance the price could bounce back up, just as it has done before. Traders use this information to plan their buy trades, expecting the price to rise again from the support level.
Resistance is the opposite of support. It is a price level where the market often stops rising and starts falling. It keeps the price from going higher. This happens because many traders see this level as a good opportunity to sell, which increases supply and pushes the price down. Let’s say EUR/USD has been climbing in value. Every time it reaches 1.0600, the price struggles to go higher and then reverses downward. This shows that 1.0600 is acting as a resistance level. Sellers are entering the market at this price. Why? They believe the Euro is overvalued compared to the Dollar and decided to sell.
However, be aware of the fact that support and resistance levels are not guaranteed to hold forever. If there is enough buying pressure, the price might break through a resistance level and continue rising. Similarly, if there is strong selling pressure, the price could break through a support level and keep falling.

How to Find Support and Resistance Forex Levels
To be a skilled trader, you must learn how to find support and resistance Forex levels. They show where prices often stop, reverse, or break. They reflect the actions of buyers and sellers. When trading with support and resistance zones, you can plan better trades, manage risk, and predict market behavior with more confidence. Here are five simple and practical methods to help you identify support and resistance levels:
- Using historical price data
- Drawing trendlines
- Moving Averages
- Fibonacci retracements
- Round numbers
Using Historical Price Data
This method involves spotting specific points on the chart where prices have stopped and reversed before. Start by opening a chart for the currency pair you want to analyze, such as EUR/USD. Look for points where the price stopped rising and reversed downward. These are the highs, which often act as resistance levels. Similarly, find the points where the price stopped falling and bounced back up—these are the lows, which often act as support levels.
Support and resistance levels are not random. They reflect trader behavior and market psychology. Many traders place their buy or sell orders around these levels. This creates predictable reactions in the market.
Drawing Trendlines
By drawing straight lines on your chart to connect multiple highs or lows, you can create a visual guide to help you understand the market’s direction and behavior. To draw a trendline, start by identifying the overall movement of the price—whether it’s rising (uptrend) or falling (downtrend).
For an uptrend, look for points where the price has made higher lows. Connect these rising lows with a straight line. This forms a support trendline, which shows where the price might stop falling during pullbacks. For a downtrend, focus on points where the price has made lower highs. Connect these falling highs with a straight line. This creates a resistance trendline, which shows where the price might struggle to rise during retracements.
Trendlines will help you visualize the market’s overall direction. Imagine EUR/USD is moving upward, forming an uptrend. You notice the price is making higher lows at 1.0200, 1.0300, and 1.0400. By connecting these points with a straight line, you create a support trendline. If the price pulls back to this line in the future, it may bounce back up. This is a potential buying opportunity. Alternatively, if EUR/USD is in a downtrend and forms lower highs at 1.0600, 1.0500, and 1.0400, you can connect these points to draw a resistance trendline. If the price rises toward this line, it may reverse and move lower, offering a potential selling opportunity.
Moving Averages
Moving averages are lines on the chart that show the average price of a currency pair over a specific period, such as 50 or 200 days. A moving average calculates the average price of a currency pair over a set time frame, updating as each new price is added. For example, a 50-day moving average shows the average price over the last 50 days. These lines often act as dynamic support and resistance levels. Unlike fixed levels, moving averages adjust as the market moves. Traders watch these levels closely, so the price often reacts when it reaches a moving average.
When the price is above the moving average, the line can act as support, where the price might stop falling and start rising. On the other hand, when the price is below the moving average, the line can act as resistance, where the price might stop rising and start falling.
Let’s say GBP/USD is trading at 1.2500 and is above its 50-day moving average, which is currently at 1.2400. The price begins to pull back toward the moving average but stops at 1.2400 and then bounces back up. In this case, the moving average is acting as a support level. Traders may see this as an opportunity to buy and expect the price to continue rising.
Fibonacci Retracements
Fibonacci retracements are based on specific ratios derived from the Fibonacci sequence, such as 38.2%, 50%, and 61.8%. These levels help traders predict where the price might pause or reverse during a trend. To use Fibonacci retracements, you need to identify a significant price movement, either an uptrend or a downtrend.
How do you draw it on your chart? In an uptrend, draw from the lowest price (swing low) to the highest price (swing high). In a downtrend, draw from the highest price (swing high) to the lowest price (swing low). Then, observe the retracement levels. The tool will automatically plot levels at 38.2%, 50%, 61.8%, and others, which act as potential support or resistance. The price often pulls back to these levels before continuing in the original direction.
Suppose GBP/USD recently moved from 1.2200 (swing low) to 1.2700 (swing high) in an uptrend. You draw a Fibonacci retracement from 1.2200 to 1.2700. The tool will create levels like:
- 38.2% retracement at 1.2510
- 50% retracement at 1.2450
- 61.8% retracement at 1.2390
If the price begins to pull back from 1.2700, it might pause or reverse near these retracement levels. For example, if it bounces back up from the 50% retracement at 1.2450, this could be a good signal to enter a buy trade, as you expect the uptrend to continue. Fibonacci levels provide precise price points to watch for reactions, making them especially useful during pullbacks.
Round Numbers
Round numbers, also known as psychological levels, are price points that end in whole numbers, such as 1.0000, 1.0500, or 1.1000. These levels often act as support or resistance because they naturally attract attention from traders. Traders tend to place buy or sell orders around round numbers. For example, a trader might set a buy order at 1.1000 rather than 1.0997 because round numbers are easier to remember and feel significant. When many traders focus on the same level, activity around that price increases. This causes the market to react.
Imagine that EUR/USD is trading at 1.0980 and is moving upward toward 1.1000. As it gets closer, you notice increased activity, such as stronger price movements or larger trading volumes. This is because many traders have set their orders around 1.1000 because they treat it as a potential resistance level. If the price struggles to break above 1.1000, it could reverse downward.

Evaluating the Strength of Support and Resistance Levels
Not all support and resistance levels are equally strong. Some are more likely to hold and cause a price reversal, while others may break easily. You need to evaluate them. There are some factors to assess strength:
- Number of touches – The more times the price touches a support or resistance level without breaking it, the stronger that level becomes.
- Time frame – Identifying support and resistance levels on higher time frames, such as daily or weekly charts, is better than identifying them on shorter time frames, like 15-minute or 1-hour charts. This is because levels on higher time frames reflect more significant market activity and decisions by institutional traders.
- Volume of trading – High trading volume around a level adds strength to it. For instance, if many trades occur at a support level, it suggests strong buying interest, making it harder for the price to break below. Conversely, high volume at a resistance level indicates strong selling interest, making it harder for the price to rise above it.
What Happens When Levels Break?
Support and resistance levels don’t always hold. When they break, they can flip roles. If the price falls below a support level and stays below, that support often turns into a new resistance level. For example, if EUR/USD breaks below 1.0200, that level might act as resistance if the price tries to move back up.
Similarly, if the price rises above a resistance level and holds, that resistance can become a new support level. For instance, if EUR/USD breaks above 1.0600, that level might act as support during a future pullback.
How to Use Support and Resistance Zones in Forex Trading
Support and resistance trading gives you valuable insights into how the market behaves. The Forex support and resistance strategy will help you:
- Anticipate price movements
- Choose entry and exit points
- Manage risk
Anticipate Price Movements
You can identify reversals using support and resistance Forex levels. If the price approaches a strong support level, it might bounce back up, signaling a potential reversal. Similarly, if the price nears a strong resistance level, it might reverse downward.
Also, you can spot continuations. If the price breaks through a support or resistance level, it often continues in the same direction. If the price breaks above strong resistance, it may signal the start of a new uptrend.
Choose Entry and Exit Points
If the price is nearing a support level, you might consider entering a buy trade, expecting the price to bounce back up. Conversely, if the price is close to a resistance level, you might consider entering a sell trade, as you anticipate the price to move down. The Forex support and resistance strategy can help you close your trades, too. For instance, if you have entered a buy trade, you might set your exit point near the next resistance level, as the price might reverse there.
Manage Risk
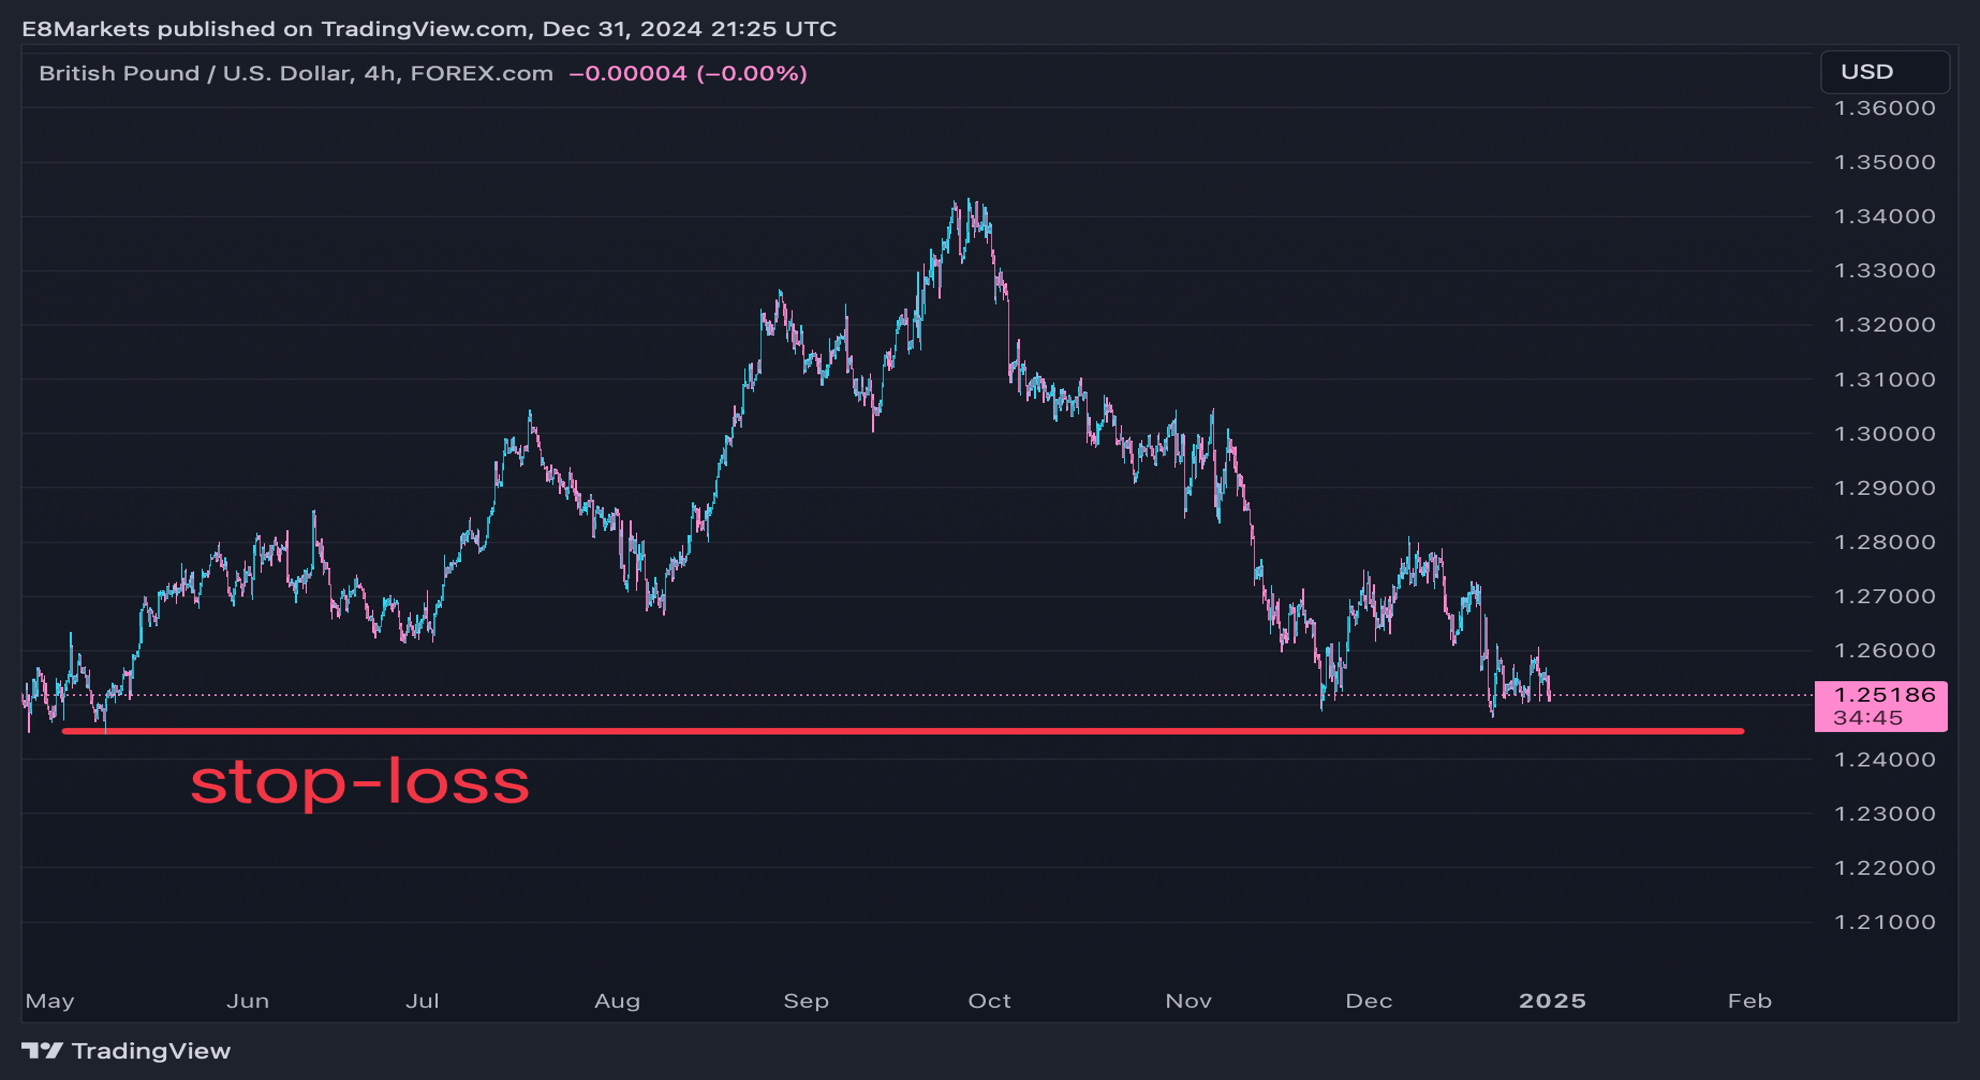
Learn how to find support and resistance Forex levels, and you will have a good idea of where to set stop-loss and take-profit orders. You can place your stop-loss order just below a support level when entering a buy trade or just above a resistance level for a sell trade. This protects you if the level breaks and the price moves against your trade. Set your take-profit order near the next resistance level for a buy trade or the next support level for a sell trade. This locks in your gains before the price has a chance to reverse.

What Not to Do
Relying on support and resistance zones without proper understanding or context can lead to poor trading decisions. Here are some common mistakes you should avoid:
- Over-reliance on a single method
- Ignoring the broader market context
- Misinterpreting weak levels as strong ones
- Overlooking market sentiment and news events
Over-Reliance on a Single Method
Do not depend on just one method to identify support and resistance levels. For example, using only technical indicators like moving averages or Fibonacci retracements without cross-checking with historical price data or trendlines can result in unreliable levels. Combining multiple methods ensures you are identifying stronger, more dependable levels.
Ignoring the Broader Market Context
The importance of support and resistance zones is huge. However, they don’t exist in isolation. Many traders make the mistake of focusing solely on their Forex support and resistance strategy without considering the overall market trend. For instance, a support level in a strong downtrend might not hold because the broader market momentum is pushing prices lower. Always analyze the market’s direction and conditions before relying on a level.
Misinterpreting Weak Levels as Strong Ones
Not all support and resistance levels are equally significant. Beginners often mistake minor price reactions for strong levels. For example, a single bounce off a level on a 15-minute chart is far less reliable than a level tested multiple times on a daily chart. Evaluate the strength of a level by considering factors like the number of touches, the time frame, and trading volume.
Overlooking Market Sentiment and News Events
A common mistake is failing to account for how market sentiment and news events affect price behavior. These factors can cause significant reactions at support and resistance levels. For instance, a strong support level may break if unexpected news or an important economic report changes the market’s outlook.
To avoid this, you can measure market sentiment using the Commitment of Traders (COT) Report. The COT report shows you how speculative traders and commercial hedgers are positioning themselves in the market. By analyzing whether traders are net long (bullish) or net short (bearish) on a currency, you can gauge the market’s overall sentiment. Always pair this analysis with staying informed about key events, such as economic reports or central bank announcements.
Decode Market Moves with Support and Resistance Levels
Support and resistance levels will help you predict price movements, plan your trades, and manage risk. Whether you are identifying levels through historical price data, trendlines, moving averages, Fibonacci retracements, or round numbers, each method adds valuable insights into market behavior. By learning to identify these levels with precision, you can anticipate price movements, pinpoint your entries and exits, and protect your balance with well-placed stop-losses. Every level you identify and every reaction you observe sharpens your Forex trading instincts. Mastering support and resistance will help you understand the market and gain the confidence to act decisively and strategically.
Trade with E8 Markets
Start our evaluation and get opportunity to start earning.Suggested Articles:
Disclaimer
The information provided on this website is for informational purposes only and should not be construed as investment advice. Always conduct your own research and consult with a qualified financial advisor before making any investment decisions. We do not endorse or promote any specific investments, and any decisions you make are at your own risk. This website and its content are not responsible for any financial losses or gains you may experience.
Please consult with a legal professional to ensure this disclaimer complies with any applicable laws and regulations in your jurisdiction.


