
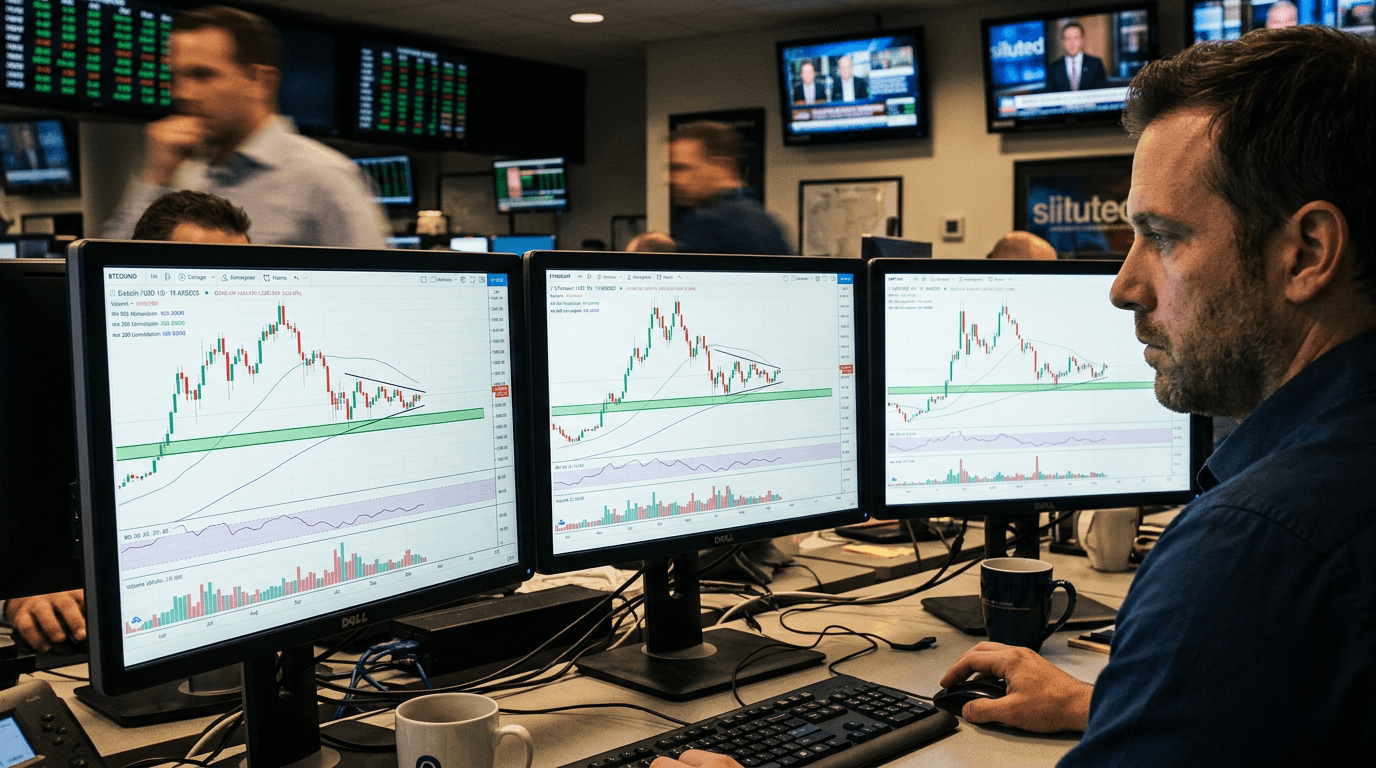
After a brisk pullback of around 2%, Bitcoin and major cryptocurrencies are catching their breath, consolidating just above key technical support zones rather than cascading lower. This type of pause after a shallow drop is often a critical moment in trend development: either buyers defend these levels and the uptrend resumes, or support gives way and a deeper correction unfolds. For now, the market is signaling caution, not panic, as traders reassess risk against a backdrop of mixed macro and geopolitical headlines.
Market Snapshot: Btc, Eth And Xrp Near Key Support
Bitcoin is still trading above the psychologically important $71,000 area, a region that aligns closely with one of the most closely watched support clusters around $70,000–$72,000.[4] This band has been identified as a “very high” strength zone, reflecting previous all‑time highs, round‑number psychology and heavy trading volume in that range.[4] When price holds above such a level after a pullback, it suggests buyers are still willing to defend the prevailing bullish structure.
Technical guides highlight multiple support layers beneath current prices, including intermediate floors in the mid‑$70,000s and a deeper accumulation zone in the $65,000–$70,000 range.[1] These stacked levels matter because they define where dip‑buyers may step in if selling intensifies. Ethereum and XRP, while driven by their own fundamentals, tend to react to Bitcoin’s directional cues; when BTC stalls at key support, majors often mirror the consolidation as traders avoid making large, one‑sided bets until Bitcoin’s next move becomes clearer (this cross‑asset behavior is a common market dynamic, inferred from broader crypto correlations).
Why Support Levels Matter In This Setup
A support level is essentially a price floor where buying pressure has historically been strong enough to stop or reverse a decline.[1][3] Each time price approaches that region and bounces, confidence in the level grows; if it repeatedly holds, traders view it as a “strong” support zone that can anchor trend continuation.[3] In Bitcoin’s case, areas like $70,000–$72,000 and the mid‑$70,000s have earned that status through repeated tests and rebounds.[1][4]
Importantly, support is not a single exact number but a zone, usually defined using tools such as historical price clusters, trendlines, moving averages and volume profiles.[3] Analysts frequently point out that popular moving averages, like the 50‑day or 100‑day, often act as dynamic support, adding technical confluence when they overlap with horizontal price floors.[1][3] High trading volume near these levels further reinforces their significance, as it signals that many participants previously found those prices attractive.[3]
In practical terms, support zones are decision points. Traders enter long positions near support with stop‑loss orders just below the zone, aiming to capture a bounce toward known resistance areas, and they wait for clear breakouts above resistance before adding to risk.[1][10] When the broader market is digesting new macro or geopolitical headlines, these levels become even more important: they offer a framework for distinguishing routine volatility from a genuine regime shift in trend.
What Current Consolidation Says About Sentiment
The current consolidation near support rather than a sharp recovery or deep sell‑off reflects a notable reduction in risk appetite. After the latest macro and geopolitical headlines, traders appear reluctant to chase upside aggressively, preferring to see how markets digest new information before committing fresh capital. That behavior is consistent with price action that “goes sideways” around an important floor instead of immediately ripping higher.
Consolidation at support can be interpreted in two main ways. On the one hand, it shows that sellers have not yet overwhelmed buyers; the support zone is still attracting demand, which helps stabilize price.[3] On the other hand, the lack of a strong rebound implies that bullish conviction has cooled and that marginal buyers may be waiting for either more attractive entry prices lower down or clearer signs that macro risks are fading. This push‑and‑pull often produces tight trading ranges, lower intraday volatility and declining volumes as both bulls and bears hesitate.
From a technical perspective, extended consolidation near support can set the stage for a larger move once the range eventually breaks. Historical case studies across Bitcoin cycles show that periods of flat trading around big levels precede significant trend accelerations, either as a springboard higher if support holds or as a trap door lower if it fails.[3][10] That binary risk is why traders watch these zones so closely in an environment of heightened macro sensitivity.
IMPACT ON CRYPTO‑LINKED EQUITIES AND DERIVATIVES
The cautious price action in Bitcoin, Ethereum and XRP is filtering directly into crypto‑linked equities and derivatives markets. When spot prices sit near key support after a pullback, listed miners, exchanges and blockchain‑focused stocks often see compressed trading ranges and elevated sensitivity to intraday crypto moves, as equity investors treat the support area as a de facto threshold for sector risk.
Derivatives markets – futures, options and perpetual swaps – also become more finely tuned to these levels. Implied volatility tends to drift lower during consolidation, even as “tail risk” pricing (for far‑out‑of‑the‑money options) remains responsive to the possibility of a breakdown below support. Professional traders closely monitor these dynamics, adjusting hedges and spread trades to account for the asymmetric risk: limited upside as long as resistance caps rallies, but potentially larger downside if a widely watched floor like $70,000–$72,000 gives way.[4][10]
This environment often encourages more market‑neutral and relative‑value strategies. For example, traders may pair long positions in fundamentally stronger coins with shorts in weaker ones, or trade volatility spreads instead of outright direction. Consolidation near support is conducive to such approaches because it provides clear reference levels for risk management while the broader narrative remains uncertain.
How Traders Can Navigate A Consolidation Near Support
For active traders and investors, the current backdrop offers both opportunity and risk. Technical best practice suggests starting with a mapping of key support and resistance zones across multiple time frames – daily, weekly and even monthly – to understand where previous reversals have occurred.[3] Levels like $70,000–$72,000, mid‑$70,000s support, and deeper floors in the high‑$60,000s stand out as structural reference points.[1][4]
Short‑term participants might look to enter tactical long positions near the lower edge of the current range, keeping stop‑losses tight below established support and targeting prior resistance bands for profit‑taking.[1][10] However, they need to respect the risk that macro or geopolitical news could quickly flip the script, turning a quiet consolidation into a swift breakdown. That makes position sizing and disciplined exits essential.
Longer‑term investors, meanwhile, often focus less on whether support holds on the first test and more on whether deeper, high‑volume accumulation zones remain intact.[1][3] If these areas continue to absorb selling over multiple attempts, they may view pullbacks as opportunities to add exposure at structurally favorable prices. In both cases, combining technical analysis with an awareness of macro drivers – policy decisions, growth data, liquidity trends and geopolitical developments – is critical. Technical support defines the battlefield; fundamentals often decide who wins.
Ultimately, consolidation near key support after a modest pullback encapsulates a familiar crypto pattern: strong prior gains, a reality check from external events, and a waiting period while markets decide whether to re‑embrace risk. How Bitcoin behaves around these levels will likely set the tone for Ethereum, XRP and the broader digital asset complex in the sessions ahead, and traders who map their decisions to these price zones stand to navigate the uncertainty with greater clarity and control.[1][3][4][10]