
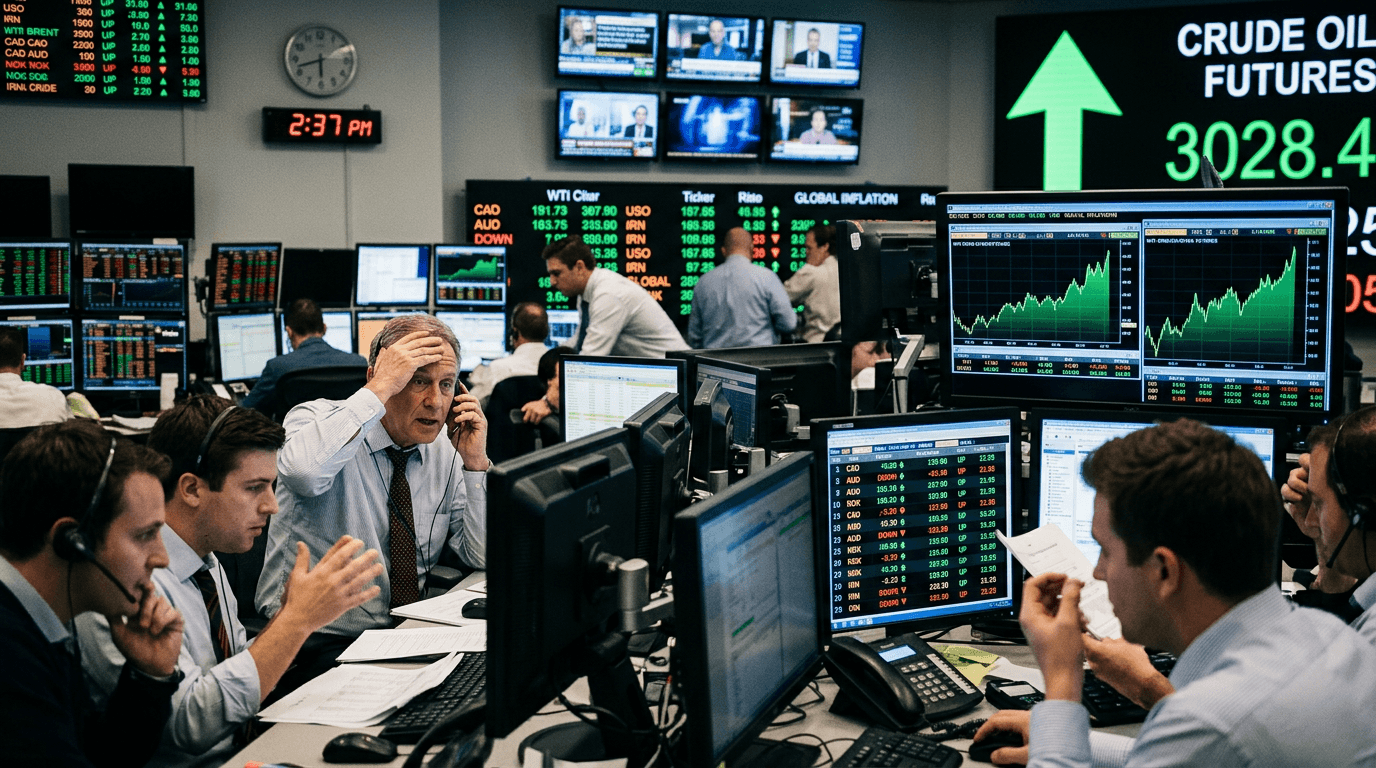
Oil has jumped back into the spotlight as the conflict involving Iran sends crude prices to multi‑month highs, reigniting volatility across commodity FX, energy futures, and inflation‑sensitive assets. US benchmark crude has pushed toward $81.64 and Brent toward $85.85, levels last seen in the summer of 2024, as traders reassess the risk of supply disruption in one of the world’s most strategically important energy corridors.
Why The Iran Conflict Matters For Oil
At the core of this move is a familiar but powerful theme: geopolitical risk colliding with a tight global supply‑demand balance. The conflict has raised fears that flows through the broader Mideast Gulf region could be disrupted, curbing exports and tightening seaborne supply just as many economies are still battling above‑target inflation.[1]
A major focus is the risk around key shipping lanes. Analysts estimate that about one‑fifth of the world’s oil supply moves through the Strait of Hormuz, the narrow chokepoint linking Gulf producers to global markets.[3] Any threat to tankers or infrastructure there tends to be priced quickly and aggressively into futures curves, even before actual barrels go offline.
We have already seen how war risk can trigger rapid repricing. Before the conflict, oil had traded in a relatively benign $60–$70 range, but earlier escalations around Iran sent prices briefly above $100 and even toward $115 per barrel as traders feared a prolonged supply shock.[2] While prices have since settled below those extremes, the market has remained highly sensitive to headlines, and today’s push back to the low‑to‑mid $80s underscores how little buffer the system has when geopolitical stress rises.
Price Action: Crude, Futures Curves And Volatility
The latest spike has been felt first and foremost in front‑month crude futures, where traders react in real time to changing risk premia. Volatility has picked up sharply as intraday ranges widen and liquidity pockets appear around major levels, particularly in West Texas Intermediate (WTI) and Brent contracts.
Beyond the front month, the entire futures curve matters. When supply fears dominate, curves often move into steeper backwardation, where near‑dated contracts trade above longer‑dated ones. That pattern reflects a willingness to pay a premium for immediate barrels versus future delivery and can signal tighter physical markets. During previous Iran‑related spikes, the front of the curve saw the largest gains as refiners and traders scrambled to secure short‑term supply.[1][2]
Options markets are also reacting. Implied volatilities on crude options tend to rise during geopolitical crises, increasing the cost of hedging for airlines, shippers, and producers. For speculative traders, this can create opportunities in volatility strategies, but also amplifies risk: moves that once happened over weeks can compress into hours when fear and positioning collide.
In practical terms, the combination of higher prices and higher volatility means margin requirements can rise, stop‑outs become more frequent, and risk management becomes just as important as directional views for anyone trading energy futures or related instruments.
Commodity Fx: Why Cad And Nok Are Catching A Bid
Oil’s rebound has provided a lift to key commodity‑linked currencies, especially the Canadian dollar (CAD) and Norwegian krone (NOK). Both economies are major energy exporters, and higher crude prices tend to support their terms of trade, corporate profits, fiscal revenues, and ultimately their currencies.
For CAD, the channel is relatively direct. Canada is a significant exporter of crude and petroleum products to the United States, so stronger oil prices can improve the country’s trade balance and underpin nominal GDP. Markets often treat USD/CAD as a quasi‑oil proxy, with the pair tending to push lower (stronger CAD) when crude rallies, all else equal.
Norway’s krone has a similar relationship, given the country’s large offshore oil and gas sector and sovereign wealth fund built on hydrocarbon revenues. While NOK can be illiquid and prone to sharp swings, sustained strength in Brent usually offers a supportive backdrop, particularly if it feeds through into better fiscal dynamics and potentially tighter monetary policy over time.
For FX traders, the key takeaway is that not all currencies respond equally to the same oil shock. Importers like the Japanese yen or Indian rupee can face headwinds when energy costs spike, while exporters like CAD and NOK can benefit. Crosses such as CAD/JPY or NOK/INR can therefore become high‑beta expressions of the oil theme, but also require careful sizing due to their sensitivity to both energy prices and broader risk sentiment.
Inflation, Central Banks And Risk Sentiment
Beyond energy and FX markets, higher crude prices are reviving an uncomfortable topic for policymakers: input‑cost inflation. When oil rises, it flows through into gasoline, diesel, jet fuel, shipping, and ultimately the cost of moving goods and people around the global economy.[3] Even if core inflation measures strip out food and energy, persistent energy shocks can seep into wages and services as businesses pass higher costs on to consumers.
Central banks that had begun to pivot toward easing face a more complicated backdrop if energy‑driven inflation risks re‑emerge. A renewed spike in oil can:
- Slow the pace or scale of expected rate cuts
- Extend the period of “higher for longer” policy rates
- Support yields at the long end of the curve if inflation expectations tick up
Equity markets also tend to bifurcate in this environment. Energy producers, oilfield services, and some commodity‑linked sectors may outperform, while energy‑intensive industries, transportation, and consumer discretionary names can come under pressure as margins compress.
For traders, this means oil is not just an isolated story—it is a macro variable that can influence everything from bond yields and inflation breakevens to sector rotation within global stock indices.
How Traders Can Navigate The Oil And Fx Spike
In a SimFi environment or live markets, the current backdrop is a textbook case study in how geopolitics, commodities, FX, and macro dynamics intersect. For active traders, a few practical principles stand out:
1. Map the transmission channels Understand how an Iran‑related supply shock transmits through oil futures into commodity currencies, inflation expectations, and risk assets. This helps you design coherent trade ideas rather than isolated bets.
2. Watch the curve, not just the headline price The shape of the futures curve—backwardation vs contango—carries information about perceived short‑term tightness versus longer‑term expectations. This can guide whether you focus on front‑month exposure, calendar spreads, or longer‑dated hedges.
3. Size for volatility With realized and implied volatility elevated, position sizing and risk limits become critical. Use smaller notional exposure, wider but well‑defined stops, and scenario analysis (e.g., “What if crude gaps $5 overnight?”).
4. Combine directional and relative trades Rather than only trading outright WTI or USD/CAD, consider relative value: CAD vs other G10 currencies, energy equities vs the broader index, or long‑short baskets that lean into the winners and hedge out broader market risk.
5. Separate short‑term spikes from structural shifts Geopolitical shocks can fade quickly if supply disruptions are avoided, as seen after earlier Iran war scares when oil spiked above $100 before retracing as markets reassessed risks.[2] Distinguish between trades aimed at capturing fear‑driven moves and longer‑term positions based on structural supply‑demand views.
Ultimately, the latest Iran‑linked jump in oil prices is a reminder that energy remains the heartbeat of the global macro narrative. For traders, it offers a rich set of opportunities across commodities, FX, and indices—but only for those who respect the volatility, connect the cross‑market dots, and let risk management shape every decision.