The US stock market encountered considerable challenges on Thursday, driven by escalating geopolitical tensions and a surge in oil prices. This created a volatile trading atmosphere for investors who are navigating an increasingly unpredictable landscape. Although the major indices initially plunged due to fears of intensifying Middle East conflict, equity markets managed a partial recovery by the day's end, yet the underlying anxiety remained tangible across Wall Street. This mixed session highlights the delicate interplay between profit opportunities and geopolitical risks, which now characterizes market sentiment as of April 2026.
Market Performance And The Volatility Surge
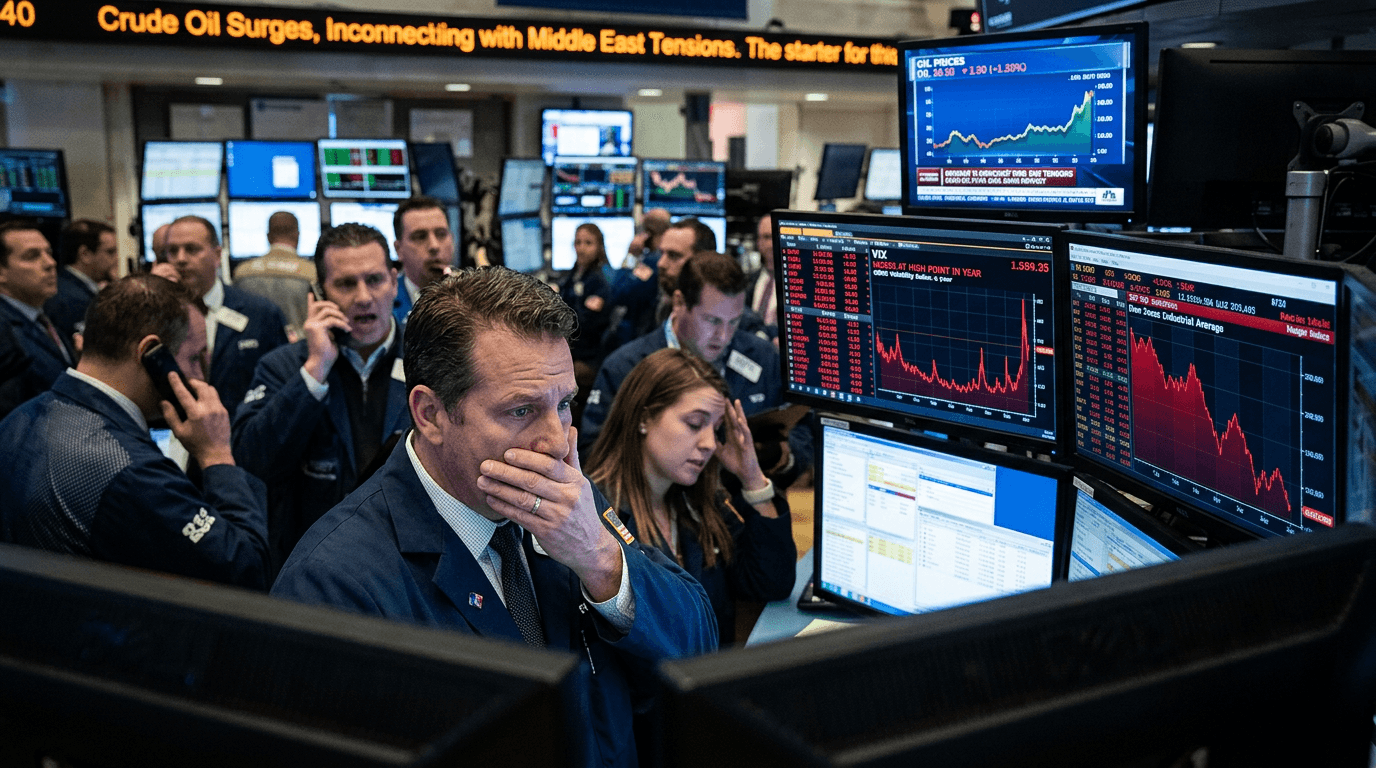
On Thursday, US equity markets closed in mixed territory, reflecting the tug-of-war between economic fundamentals and geopolitical uncertainty. The Dow Jones ended slightly lower, while the S&P 500 and Nasdaq saw modest gains after bouncing back from early losses. However, looking beyond these figures reveals more profound concerns. Recently, the S&P 500 fell 1.67% to 6,368 points, the Dow Jones Industrial Average dropped 1.73% to 45,166, and the Nasdaq 100 dipped 1.93% to 23,132, pushing major indices toward correction territory.
A notable indicator of market sentiment was the rise in fear gauges. The CBOE Volatility Index surged by 13.16% to 31.04 points, marking its highest level in nearly a year, which underscores the pervasive anxiety gripping financial markets. This surge in volatility suggests that institutional investors are factoring in prolonged uncertainty as the US, Israel, and Iran remain locked in conflict without an immediate resolution in sight. For traders who have grown accustomed to recent market stability, this shift represents a significant recalibration of risk expectations.
The Oil Factor: Energy Drives Market Swings
Energy markets experienced a dramatic upswing driven by legitimate concerns over potential supply disruptions due to Middle East tensions. Brent crude futures rose 3.37% to $105.32 per barrel, while West Texas Intermediate climbed 5.46% to $99.64 per barrel, as traders incorporated significant geopolitical risk premiums. This surge in energy prices directly impacted equity markets, as higher oil prices threaten corporate profit margins and increase inflation expectations across the economy.
The current pricing dynamics in the oil market reveal something critical about existing market conditions. Presently, oil markets are factoring in geopolitical risk premiums estimated at $7 to $9 per barrel, indicating that a significant portion of current crude prices serves as insurance against potential disruptions rather than reflecting fundamental supply and demand changes. This distinction is crucial for investors as it suggests that crude prices could drop sharply if geopolitical tensions ease, particularly if the critical Strait of Hormuz—through which about one-third of global seaborne oil passes—remains open. In fact, sentiment improved later on Thursday after Iran indicated it was cooperating with Oman to manage traffic through this vital global oil route, providing some relief during afternoon trading.
Understanding The Geopolitical Risk Premium
The concept of a geopolitical risk premium has become central to understanding current market dynamics. This premium represents the additional cost investors demand to hold assets when political uncertainty threatens normal operations. In this scenario, the $7 to $9 per barrel premium reflects concerns that military escalation could disrupt supply chains, especially from the Middle East.
For equity investors, this premium translates into ongoing headwinds as long as tensions remain unresolved. The five-week conflict involving the United States, Israel, and Iran threatens to derail the recent market rally that had pushed equity indices toward new highs. Investors must weigh the likelihood of continued hostilities against the possibility of diplomatic resolution. This uncertainty typically benefits defensive assets while exerting pressure on growth stocks that are most sensitive to economic slowdowns triggered by elevated energy costs.
Safe Havens And Shifting Portfolio Dynamics
As equity markets struggled, traditional safe-haven assets drew significant interest from risk-averse investors. Gold futures rose 2.66% to $4,492 per ounce as investors aggressively sought refuge from geopolitical uncertainty. Interestingly, gold prices have retraced approximately 8% from their all-time highs, creating what many investors perceive as attractive entry points at a discount.
This dynamic demonstrates how geopolitical risk can override traditional monetary policy relationships. Despite facing headwinds from a hawkish Federal Reserve environment and stronger dollar pressures, gold rallied because the demand for protection against prolonged conflict outweighed typical market dynamics. For portfolio managers, this underscores the importance of maintaining diversified holdings that perform well during crisis periods.
What Investors Should Watch Going Forward
The pressing question for investors is whether the recent market decline represents an overcorrection to temporary risks or a genuine repricing that will endure. The answer likely hinges on developments in three areas: the trajectory of Middle East tensions, clarity on the Federal Reserve's policy path, and whether oil supply actually faces disruption. Additionally, University of Michigan inflation expectations for March rose significantly, surpassing analyst forecasts and highlighting growing anxiety over price stability.
For traders navigating this environment, opportunities exist in both crisis scenarios. Energy stocks may rebound sharply if tensions ease and the geopolitical risk premium compresses. Conversely, defensive sectors and gold remain attractive if uncertainty persists. The combination of strong earnings growth and renewed geopolitical uncertainty will likely drive continued volatility, with equities potentially finding stability once clarity emerges regarding both the Middle Eastern situation and the Federal Reserve's actual policy path.
---