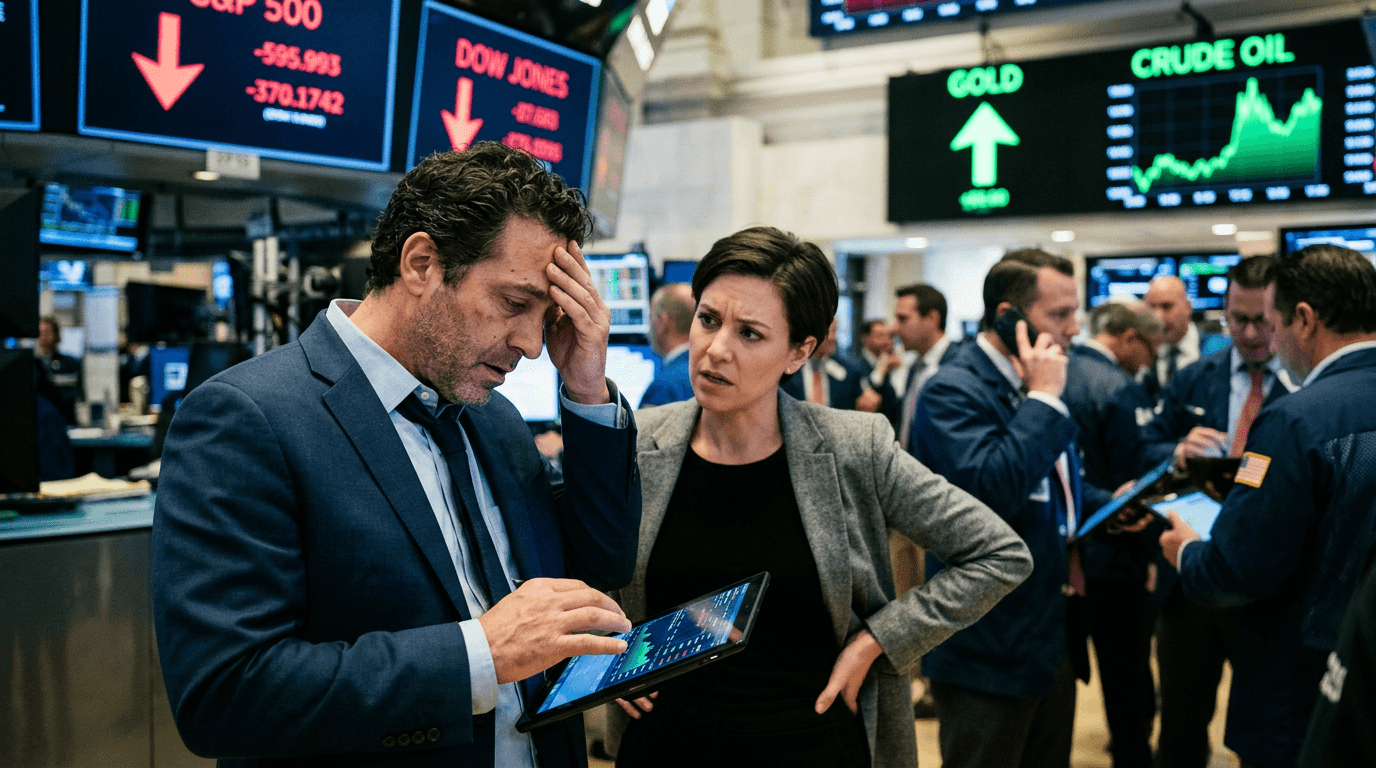
US stocks sold off as traders grappled with an unusual combination of signals: a sharp drop in producer prices, a spike in crude oil, and mounting chatter about recession and stagflation. Equities retreated, gold and other safe havens caught a bid, and risk‑sensitive currencies weakened as investors reassessed both growth and inflation risks in one move.
What Happened In The Market
The session started with what might normally look like good news: a downside surprise in the Producer Price Index (PPI), suggesting that wholesale inflation pressures are easing. The PPI tracks the average change over time in the prices received by domestic producers for their output, effectively measuring inflation from the seller’s perspective.[3] A softer reading often boosts risk appetite because it can lower pressure on central banks to keep rates high.[2][4]
This time, however, the reaction flipped. At the same moment that PPI signaled cooling price pressures, oil prices jumped sharply. A sudden surge in crude raises costs across the economy, especially in transportation, manufacturing, and energy‑intensive industries. The market read this combination as a warning that growth could be slowing just as a key input cost is rising.
Equity indices fell broadly, with cyclical and energy‑sensitive sectors seeing outsized moves. Financial conditions tightened as equity volatility ticked up, risk‑off flows moved into gold and high‑quality bonds, and risk‑sensitive FX — such as commodity‑linked and emerging‑market currencies — came under pressure. It was a textbook shift from “risk‑on” to “risk‑off” sentiment.
Why A Softer Ppi Can Still Scare Investors
To understand why a downside PPI surprise spooked investors, it helps to unpack what PPI actually captures. The Producer Price Index measures changes in wholesale prices for goods and services at the producer level, providing an early signal of inflation before it hits consumers.[2][3] When PPI rises persistently, it often foreshadows higher consumer prices and more aggressive monetary tightening.[2][4]
However, a sharp downside surprise can carry a different message: weakening demand. If producers are accepting lower prices, it can mean they are losing pricing power because end demand is cooling. In other words, falling PPI is not always “good” disinflation; it can be a symptom of an economy losing momentum.
Markets are especially sensitive to surprises. Research and trading practice both show that when PPI prints significantly above or below expectations, it tends to trigger volatility and sector rotation as traders rapidly adjust their views on profits, interest rates, and inflation.[5] A downside surprise can pull growth expectations lower and raise concerns about corporate earnings, particularly in industries where margins are already thin.
In this case, the PPI drop was large enough to tilt the narrative toward a potential growth scare. Rather than celebrating lower inflation, traders asked a tougher question: are we seeing the early signs of a recessionary slowdown?
The Oil Surge And Stagflation Fears
Layered on top of the PPI surprise was a sharp move higher in oil. Rising crude prices feed into higher transportation and production costs, affecting everything from logistics companies to airlines to consumer goods producers. For many sectors, energy is a non‑discretionary input: when it becomes more expensive, margins get squeezed unless companies can pass those costs on.
When oil surges even as producer prices fall elsewhere, it creates a problematic mix. Lower PPI ex‑energy can signal weakening demand and softer prices across the broader economy, while higher energy costs keep headline inflation sticky. That is the classic recipe for concerns about stagflation — a period of low growth and elevated inflation.
This is why safe havens rallied as equities slid. If investors believe growth is at risk but inflation cannot fall quickly because of energy, they may expect central banks to be more cautious about rate cuts. That uncertainty makes assets like gold more attractive, as it is often viewed as a store of value when both inflation and growth risks are elevated.
For equities, the stagflation narrative is particularly uncomfortable. Revenue growth can slow as demand weakens, while cost pressures stay high. Price/earnings multiples tend to compress in that environment, and markets can re‑price quickly when that scenario enters the conversation.
How Traders Can Navigate This Kind Of Risk-off Day
For active traders, sessions like this underscore how important it is to think in terms of macro “regimes,” not just single data points. A downside PPI surprise in a stable oil environment might be positive for stocks, but the same PPI surprise alongside an oil spike sends a very different signal.
Here are a few practical angles to consider
- Watch the surprise, not just the level. Markets tend to react to the difference between actual and expected PPI, not just whether it is “high” or “low.”[5]
- Track cross‑asset confirmation. If stocks are selling off while gold, Treasuries, and the US dollar are rallying, the move is more likely a broad risk‑off shift rather than a sector‑specific story.
- Think in terms of sectors. Energy producers may benefit from higher crude, while energy‑intensive industries and consumer discretionary names may suffer from squeezed margins and weaker demand.
- Adjust position sizing to volatility. Economic‑data surprises can cause sudden spikes in volatility; using tighter risk controls, smaller sizes, or wider stops on data days is a practical way to manage drawdowns.
For swing and position traders, days like this can also set new short‑term regimes. If the market narrative shifts to “recession and stagflation worries,” factor exposures such as quality, low volatility, and defensive sectors often outperform cyclicals and high‑beta names until the macro story changes.
Implications For Simulated And Real-money Traders
For traders using a simulated finance (SimFi) environment, this kind of session is an ideal stress‑test. Because PPI is a regularly scheduled release tracked closely by central banks and investors,[2][3] it offers repeatable scenarios that you can practice around: upside surprise, downside surprise, and “as expected” outcomes.
In a SimFi setting, you can:
- Backtest strategies around PPI releases to see how your approach behaves when the data diverges from consensus.
- Simulate cross‑asset trades — for example, long gold vs. short equity indices during stagflation scares — to understand correlations and hedging behavior.
- Practice intraday risk management: how quickly to cut losers when a macro narrative shifts, or how to scale into positions as volatility either spikes or fades.
The goal is not to “predict” every data print, but to build playbooks for different regimes. If you know in advance how you plan to respond to a downside PPI surprise combined with an oil spike, you are less likely to overreact emotionally when the market starts moving.
Ultimately, the sell‑off triggered by the oil surge and PPI downside surprise is a reminder that macro trading is rarely about single headlines. It is about how data points interact, how they reshape expectations for growth and inflation, and how that, in turn, reprices risk across equities, bonds, commodities, and FX. Whether you trade live capital or in a simulated environment, the edge comes from understanding those connections — and having a plan before the next surprise hits.