
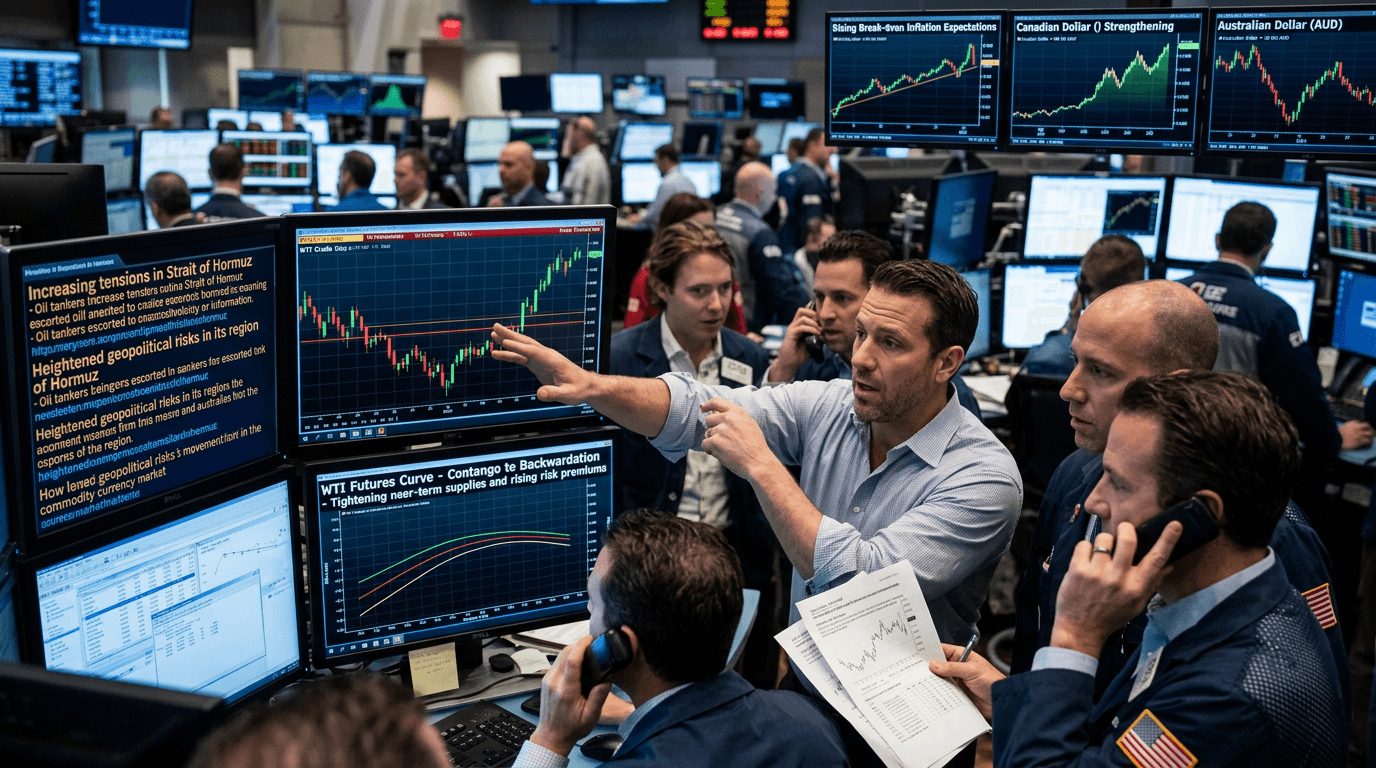
WTI crude’s latest rebound is more than just another price swing—it is a high‑stakes repricing of global energy risk as war in the Middle East and tensions around the Strait of Hormuz threaten to disrupt the flow of oil to world markets. Traders are rapidly rebuilding a geopolitical risk premium into crude benchmarks, reshaping futures curves, inflation expectations, and the performance of commodity‑linked currencies in the process. For both discretionary traders and systematic strategies, this is a regime shift that demands close attention.
Drivers Of The Wti Crude Rebound
The first driver behind the rebound is simple but powerful: supply risk. The Strait of Hormuz is the choke point through which a significant share of seaborne crude and refined products move each day. Any threat to that corridor—whether direct military action, sanctions escalation, or shipping disruptions—forces the market to reassess the probability of lost barrels and logistical bottlenecks. Even before actual physical flows are interrupted, traders respond to perceived risk by bidding up nearby contracts, lifting spot prices and front‑month futures.
Second, positioning and sentiment have amplified the move. In recent months, WTI sold off toward multi‑year lows, with prices probing the $55–60 region and forming a double‑bottom base that marked the weakest levels since 2021.[9] When geopolitical headlines turned, that deeply bearish positioning became fuel for a sharp reversal: short‑covering, fresh hedging from consumers, and renewed speculative longs all drove the rebound as traders rushed to rebuild protection against higher prices.
A third driver is the macro overlay. Higher crude quickly translates into higher implied inflation, especially in regions where energy costs feed directly into consumer prices and corporate margins. That, in turn, influences rate expectations and cross‑asset flows. Bond markets reprice breakeven inflation, equity investors reassess earnings sensitivity to energy, and FX traders re‑evaluate the prospects of exporters and importers. The result: oil is no longer a standalone story; it becomes a core macro narrative again.
Key Technical Levels In Focus
Under the surface of the headlines, WTI’s technical structure has shifted meaningfully. Recent analysis shows that crude has rebounded from a low near $61 and reclaimed important Fibonacci retracement levels around $64–65, with bulls now eyeing resistance near $70–71.[7] At the same time, the market has managed to hold above the key psychological barrier at $60 while defending a $55 double‑bottom base—the lowest zone since 2021.[9] Together, these levels define the new “line in the sand” for the trend.
One widely tracked roadmap places particular emphasis on the 0.5–0.618 retracement band around $67.94, treating it as a pivotal decision point. If WTI can sustain trade above that area, upside targets around $77 and even $81.5 come into view for bullish participants.[5] Failure to hold, by contrast, would warn that the rebound is losing steam and could reopen downside toward the mid‑60s and potentially back to the $60 handle.[5]
Other short‑term frameworks highlight a higher resistance cluster in the $74–76 zone, arguing that this area will likely decide whether the current move evolves into a durable uptrend or fades as a lower high in a broader range.[2] A decisive break above that band could extend the rally toward the $80 region, while a rejection there would suggest that the market remains more balanced than the headlines alone might imply.[2] For active traders, these zones are crucial: they provide clear levels for scenario planning, risk placement, and strategy testing.
Takeaway: The rebound has pushed WTI back above major support and into a dense band of technical levels. How price behaves around $68–76 will determine whether this becomes a sustained bullish phase or just a spike within a wider range.
Global Ripple Effects: Inflation, Currencies, And Risk Assets
Higher and more volatile crude prices quickly spill over into other asset classes. On the macro side, the immediate channel is inflation. Energy is a significant input into transportation, manufacturing, and household costs; a sustained move higher in oil raises the odds that headline inflation prints remain stubborn, even if core components are cooling. Bond markets reflect this through higher breakeven inflation rates and, in some cases, renewed pressure on longer‑dated yields as investors price in more persistent price risks.
In FX, “petro‑currencies” such as the Canadian dollar (CAD) and Norwegian krone (NOK) tend to be sensitive to oil price swings. When crude rallies on supply risk, these currencies can outperform peers as markets anticipate improved terms of trade and stronger export revenues. However, the story is nuanced: if the shock triggers broad risk‑off sentiment—tightening financial conditions and pressuring equities—CAD and NOK can see opposing forces, with energy strength offset by global risk aversion. Skilled traders watch not only crude itself, but also how rates, equity volatility, and broader risk indicators interact with these currencies.
Equity sectors also reprice. Energy producers and service firms often benefit from higher prices and wider margins, while energy‑intensive industries face compressed profitability. Index investors need to think in terms of relative winners and losers, not just the headline level of oil. For portfolio managers, the question is whether this is a short‑lived spike or the start of a longer period of elevated energy volatility that will reshape sector performance.
Takeaway: Crude’s rebound is a cross‑asset event. It touches inflation expectations, yield curves, commodity‑linked currencies, and sector rotations, making it critical for traders who operate beyond the oil market itself.
How Traders And Simulated Investors Can Navigate The Volatility
For active traders, this environment rewards preparation and discipline. One sensible approach is to build clear scenarios around the key levels discussed earlier: bullish continuation above $74–76, range‑bound behavior between roughly $60 and $75, or a failed breakout that sends prices back toward the $60–65 band.[2][5][7][9] Each scenario implies different tactics—trend‑following versus mean‑reversion, spread trading along the futures curve, or cross‑asset strategies linking oil to FX and equities.
Risk management becomes non‑negotiable. Geopolitical moves can be abrupt, and liquidity may thin at times of stress. Position sizing, defined stop‑losses, and careful monitoring of overnight risk are essential. Options, where available, provide another dimension: traders can express views on volatility as well as direction, for example by buying calls to benefit from higher prices while capping downside, or using spreads to minimize premium outlay.
For simulated finance (SimFi) users and strategy developers, this is an ideal testing ground. A simulated environment allows you to:
Experiment with different responses to curve shifts, such as moving from flat price exposure to calendar spreads when front‑month contracts become more volatile.
Test multi‑asset frameworks that link WTI moves to CAD and NOK, or to energy equity baskets, without risking real capital.
Evaluate how various risk rules—like maximum loss thresholds or volatility‑adjusted position sizing—perform when markets are moving on geopolitical headlines rather than scheduled data releases.
Takeaway: Use current conditions to refine your playbook. Whether you trade live or in simulation, define scenarios, codify your risk rules, and test how your strategies behave when crude is driven by geopolitics rather than purely by supply‑demand data.
What To Watch In The Weeks Ahead
Looking forward, a few markers will help traders gauge whether this rebound evolves into a sustained regime shift:
Does WTI hold above the $60–65 base and consolidate gains, or does it slide back once the immediate shock fades?[7][9]
Can bulls break and sustain trade above the key resistance bands near $68 and $74–76, opening the way toward the $77–81 area?[2][5][7]
Do inflation expectations and bond yields move meaningfully higher alongside oil, or do central bank credibility and slower growth keep broader price pressures contained?
How do CAD and NOK behave—do they track crude higher in a classic petro‑currency pattern, or does risk sentiment distort the usual correlations?
For traders and investors alike, the message is clear: crude has reasserted its role at the center of global macro and market structure. By combining an understanding of geopolitical drivers with disciplined technical analysis and robust risk management—preferably honed in a simulated environment before being deployed with real capital—you can turn this period of heightened energy volatility from a source of uncertainty into a set of tradable opportunities.